Schema & Profiling Tab
View and manage your source schema, run data profiling, and preview sample data.
The Schema & Profiling tab provides a central view for inspecting your source and asset schema, running data profiling, and previewing sample rows.
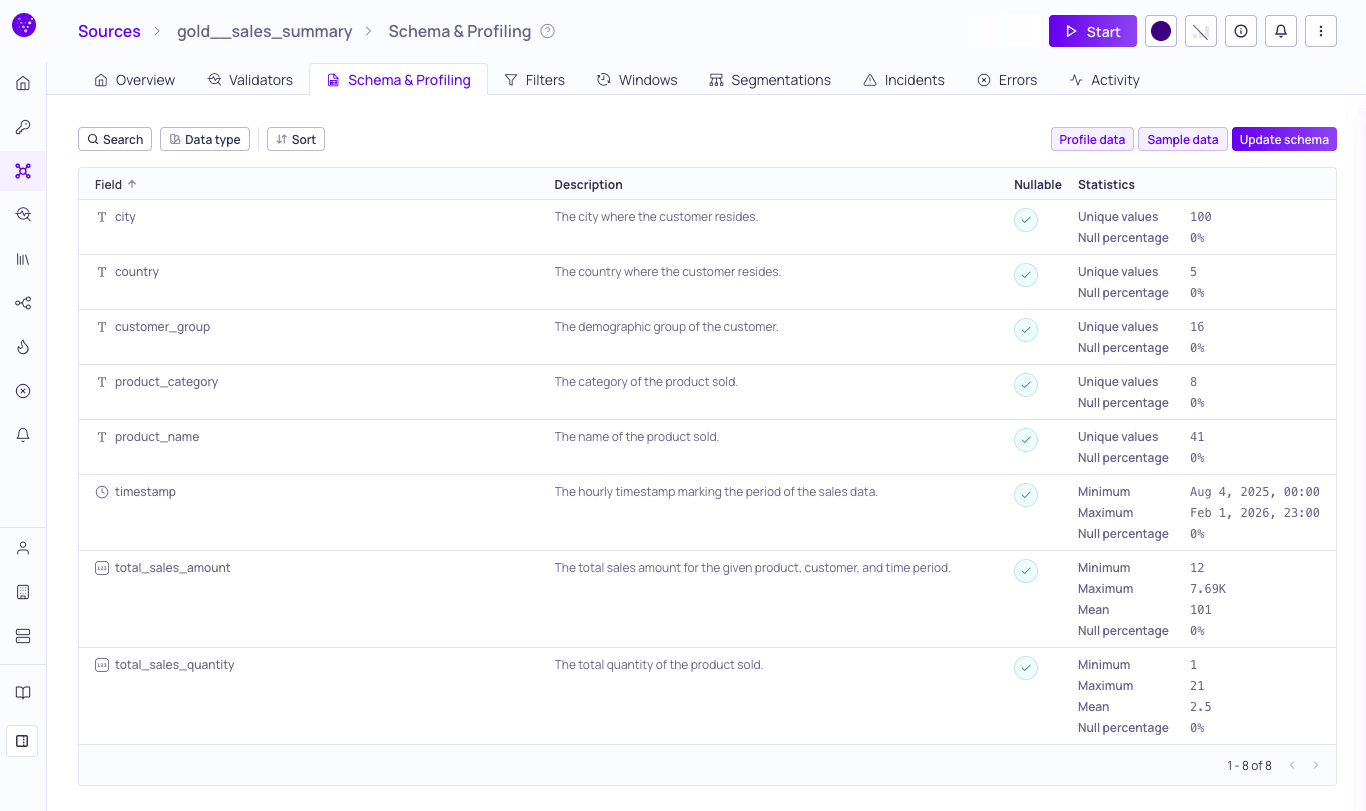
Schema & Profiling tab for a source
Schema List
The table displays the detected schema for your source and catalog asset, including field names, data types, nullability settings, and profiled statistics.
From this section you can:
- View the full list of fields, their data types, descriptions, and statistics.
- Open the Schema field sidebar to inspect an individual field's metadata, profiling, glossary terms, and tags.
- Search for specific; filter by Data type, Glossary term, Classification, and data quality Dimension; and Sort the list order.
- Update nullability settings and data types to better reflect your data structure. (The Update schema button is available for sources, but not catalog assets.)
For details on how Validio automatically derives schemas through metadata reading, inference, and manual configuration, see Schema Detection.
Schema Field Sidebar
The Schema field sidebar is a contextual panel that shows the metadata, profiling statistics, glossary terms, and tags of a single schema field. Open it from the Schema & Profiling tab or from the Lineage graph to inspect or edit a field without leaving your current view.
Open the Sidebar
- In the Fields table on the Schema & Profiling tab, click a row.
- On the Lineage page, expand a schema node and click a field row.
Selecting a field pins a fieldId query parameter to the URL so the view is shareable. Close the sidebar to clear the selection from the URL.
Sidebar Contents and Actions
Each section of the sidebar shows specific field information and exposes the related actions:
- Header — Field path, data-type icon, and an editable multi-origin description with markdown support. Edit the description inline (requires the
catalogAssets:WRITEpermission — see Managing Roles), generate one with AI using a configured LLM credential, or click View Asset Lineage to open the asset's lineage with this field preselected. - General — Nullability indicator.
- Statistics — Profiling metrics and data-type-specific stats. Displays "No profiling" when none has been collected. For more information, see Data Profiling.
- Glossary terms — Assigned terms, with propagation indicators showing when a term was inherited from an upstream field. Assign or unassign terms inline. For more information, see Glossary Term Assignments and Glossary Term Propagation.
- Tags — Applied tags with creation and update metadata and origin source. Add or manage tags inline. For more information, see Managing Tags.
Data Profiling
Data Profiling provides on-demand statistical analysis of the fields in your source or asset table to provide information for setting up validators. You can trigger a profiling run to calculate summary statistics for each field.
Profiling results are specific to the types of data. For example, results may include metrics such as:
- Null percentages and unique values (for all data types)
- Minimum, maximum, and mean values (for numeric fields)
- Maximum and minimum length (for strings)
To profile data, navigate to the Schema & Profiling tab, click Profile data, and configure the profile settings in the dialog. Results are displayed inline for each field once the run completes. For more information, see Data Profiling.
Data Sampling
Data Sampling returns a quick view of your source or catalog asset rows, letting you verify patterns and inspect actual values before you set up filters and segmentation.
To sample data, open the Schema & Profiling tab, click Sample data, and configure the sample size in the dialog. For more information, see Data Sampling.
Updated 3 months ago