Data Profiling
Run on-demand statistical analysis of your source fields to understand data patterns and quality.
Data profiling in Validio provides on-demand statistical analysis of your source fields, helping you understand data distribution and patterns before configuring validators. You can also use Data Sampling to preview actual rows from your source.
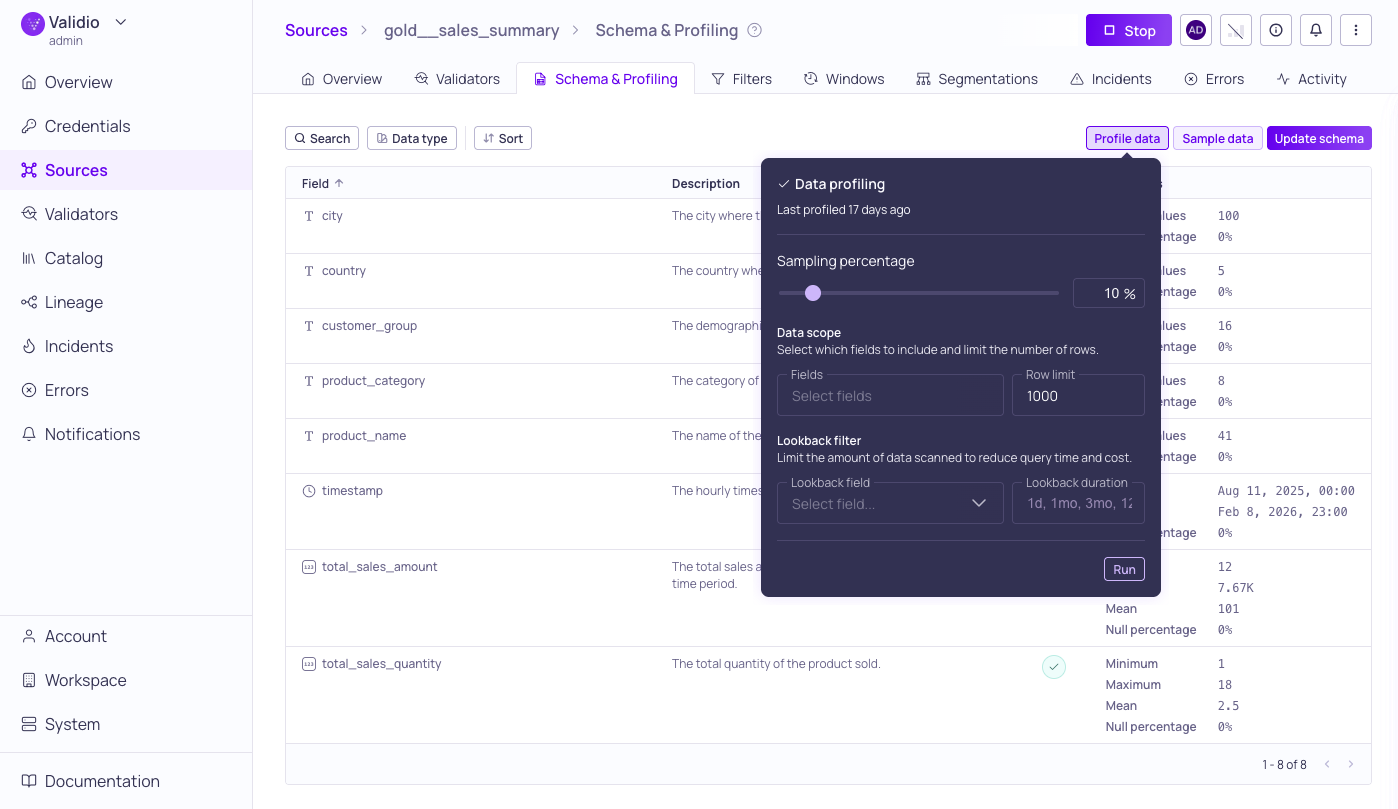
Data Profiling configuration with results of previous run
Data Profiling provides statistical analysis of the data in your source or catalog asset at the table, field, and segment level. Use it to understand the distribution of values in your data, identify quality issues, and inform your validator setup. Validio supports both on-demand profiling from the UI and continuous profiling through validators.
How Profiling Works
Profiling operates at different granularities and across both data values and metadata.
Profiling modes
Validio offers two ways to profile your data:
- On-demand profiling — Trigger a one-time profiling run from the Schema & Profiling tab. This is useful for initial exploration of a new source or for spot-checking data before configuring validators. See Running a Profile below.
- Continuous profiling — Run profiling automatically on a configurable schedule (hourly, daily, weekly, monthly, or other cadences) or trigger it as part of a data pipeline. Continuous profiling is configured through validators, which monitor your data on an ongoing basis and alert you when metrics deviate from expected patterns.
Statistical profiling
Statistical profiling analyzes the actual values in your data at three levels:
- Table level — Aggregate statistics across the entire table, such as row count and overall null rates.
- Field level — Per-column statistics, as shown in the Profile Metrics section. This is the default view in the Schema & Profiling tab.
- Segment level — Statistics for specific data groups. Use segmentation to profile groups independently, revealing quality issues hidden in aggregate views.
Metadata profiling
Validio also automatically profiles metadata at the dataset and table level, including:
- Read and write activity on the table.
- Tags from the source system or third-party tools such as dbt.
- Descriptions and ownership information imported from catalog tools such as Atlan.
Metadata profiling runs automatically and requires no additional configuration.
How Profiling Handles Your Data
For data warehouse and query engine sources, profiling computes its statistics inside your warehouse using aggregate queries and returns one row of statistics per field — never raw rows. For example, the unique-values metric returns only the distinct count, not the underlying values. Profiling runs against the full table by default and has no fixed row limit; you can narrow the scope with the Sampling Percentage, Data Scope, and Lookback Filter options described under Running a Profile.
Most of the statistics Validio stores are counts and percentages, but a small, bounded subset are actual values observed in the column: numeric minimum, maximum, median, and quartiles, and timestamp minimum and maximum. Text and boolean fields store no values. These boundary statistics are stored as part of the profile, so for assets too sensitive to retain even these values, you can choose not to profile them. For the full picture of what Validio stores, see Data Handling and Retention.
Running a Profile
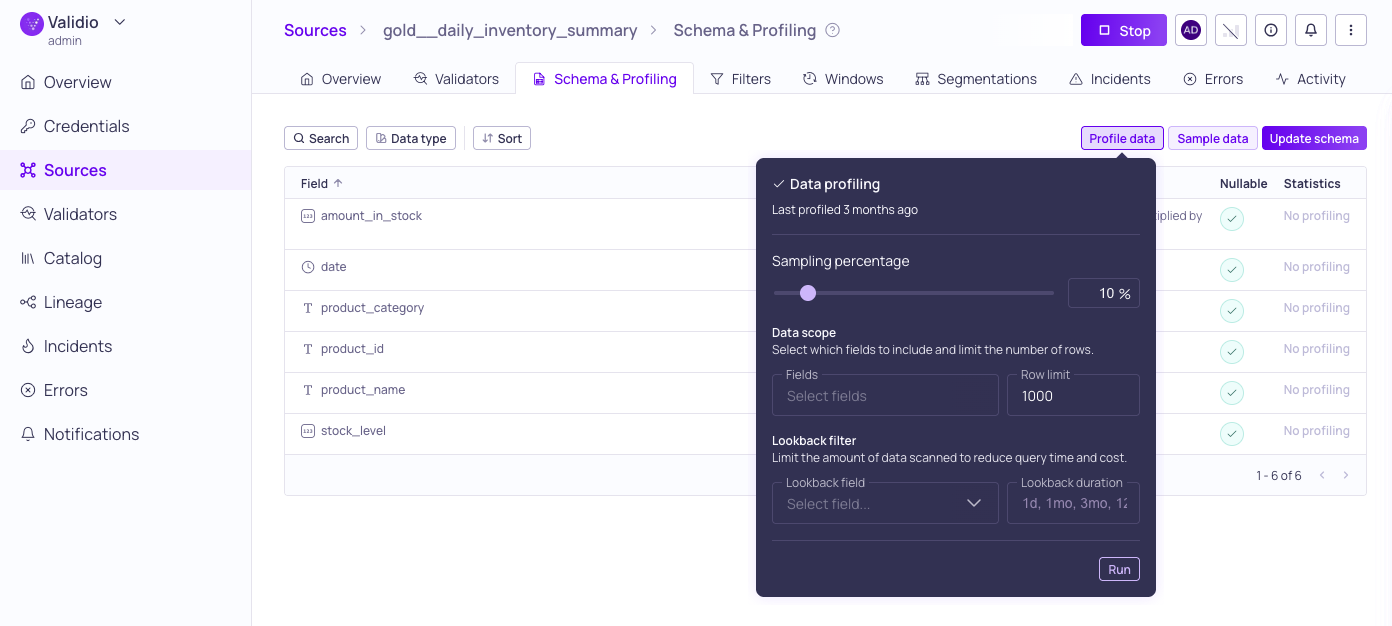
Data profiling configuration options
To profile your source or catalog asset:
-
Navigate to the Schema & Profiling tab.
-
Click Profile data and configure the profiling settings in the dialog to ensure that profiling only reads the necessary amount of data, preventing timeouts and excessive processing costs.
-
Sampling Percentage: (Only available for tables and materialized views.) Use the slider or enter a number to adjust the percentage of data to include in the profiling run. Lower values speed up profiling on large tables while still providing representative statistics. Defaults to 10%.
-
Data Scope: (Recommended) Cap the execution time on large datasets by limiting the fields and number of rows used for profiling:
Setting Description Fields Select specific fields to analyze. By default, all fields are profiled. Row limit Set the maximum number of rows to include in the profiling run. -
Lookback Filter: (Recommended) Limit the data volume scanned by targeting only a specific window of recent data:
Setting Description Lookback field Select a timestamp or date field to define the profiling window. This limits the scan to recent data rather than scanning the full dataset. Lookback duration The specific amount of time to look back when filtering data. Use this with the Lookback field to target only recent records and optimize performance. -
Credential (Only for catalog assets): Select a credential to use when profiling data.
-
-
Click Run to start the profiling run.
- To cancel a running profile (for example, if profiling takes too long to complete), open the Profile running dialog and click Cancel. Adjust the settings before you run a new profile.
Results are displayed inline for each field, under Statistics, once the run completes.
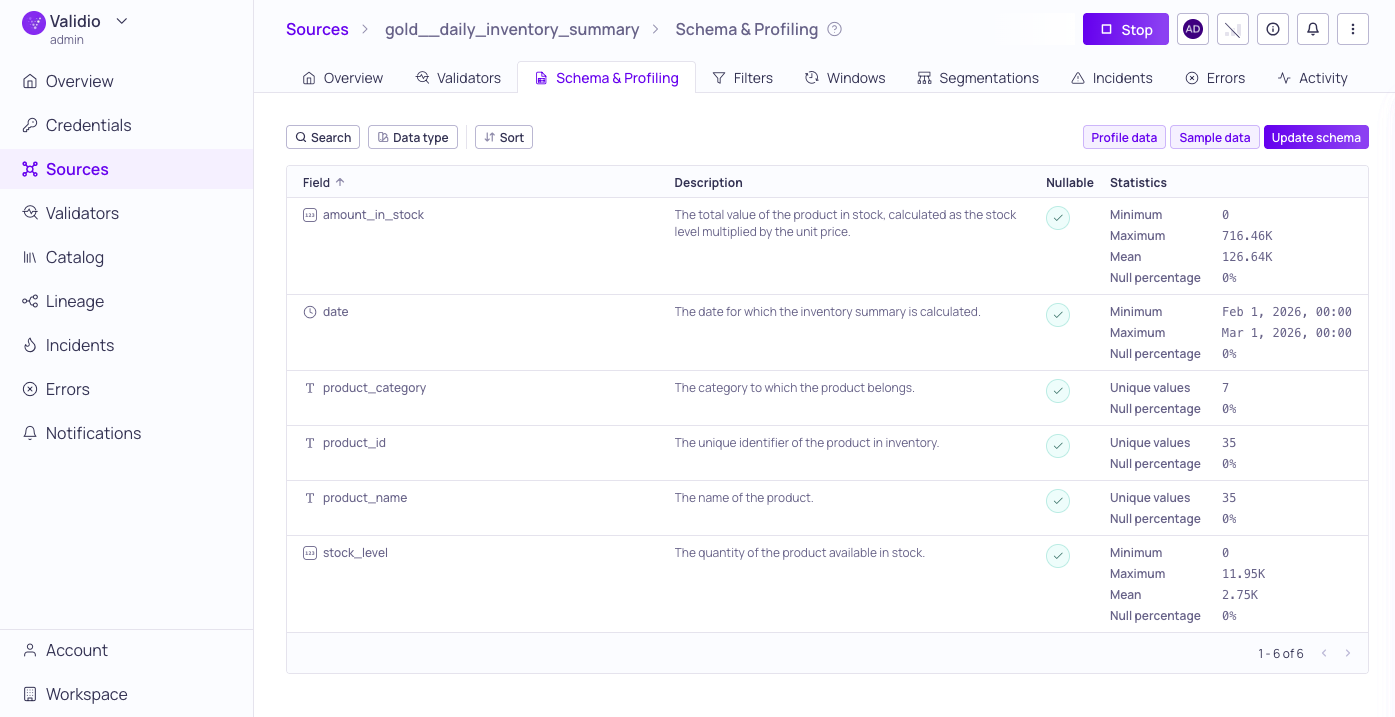
Data profiling results for one month lookback
Profile Metrics
Profiling results provide statistics specific to the data type of each field:
| Metric | Description |
|---|---|
| Max | The maximum value (numeric fields) or maximum length (strings). |
| Mean | The average value (numeric fields). |
| Min | The minimum value (numeric fields) or minimum length (strings). |
| Null percentage | The percentage of rows with a NULL value for this field (all data types). |
| Unique Values | The number of unique values for this field (all data types). |
Additional profiling dimensions such as freshness, completeness, accuracy, and consistency are available through validators.
Interpreting Results
Profile results are shown alongside each field in the schema list. Use the results to:
- Identify fields with high null rates that may need attention.
- Spot unexpected value ranges or distributions.
- Verify that data types and field contents match your expectations before setting up validators.
- Inform which validators to configure based on observed data patterns. See Validator Recommendations for AI-assisted suggestions.
- Compare profiling results across subsets to detect inconsistencies in specific data segments.
Updated about 1 month ago