Reference Source Validation
Learn how to configure reference sources for data validation.
Reference sources allow you to calculate metrics by comparing your data against a ground truth or baseline source that you specify. This feature enables sophisticated data validation scenarios such as:
- Cross-source comparisons: Compare data between two completely different sources, such as production data against staging or development environments.
- Time-based analysis: Create sliding windows to compare current data against historical patterns.
- Ground truth validation: Validate incoming data against known-good reference datasets, for example comparing data between old and new systems during migration to ensure accuracy and completeness.
- Historical trend analysis: Detect deviations by comparing against established baselines, such as current performance against the same period last week, month, or year.
Supported Validator Types
You can only configure a reference source for specific validator types that support comparative analysis:
| Validator Type | Description |
|---|---|
| Categorical distribution | Compare the distribution of categorical values |
| Numeric distribution | Compare statistical distributions of numeric data |
| Relative volume | Compare data volumes and patterns |
Referential Integrity Validation: Referential integrity validators allow you to compare data sets across two sources, but does not share the same configuration or behaviors of the validators described here. For more information, see Referential Integrity
Configuration Parameters
You can configure reference sources with field, filter, or window settings:
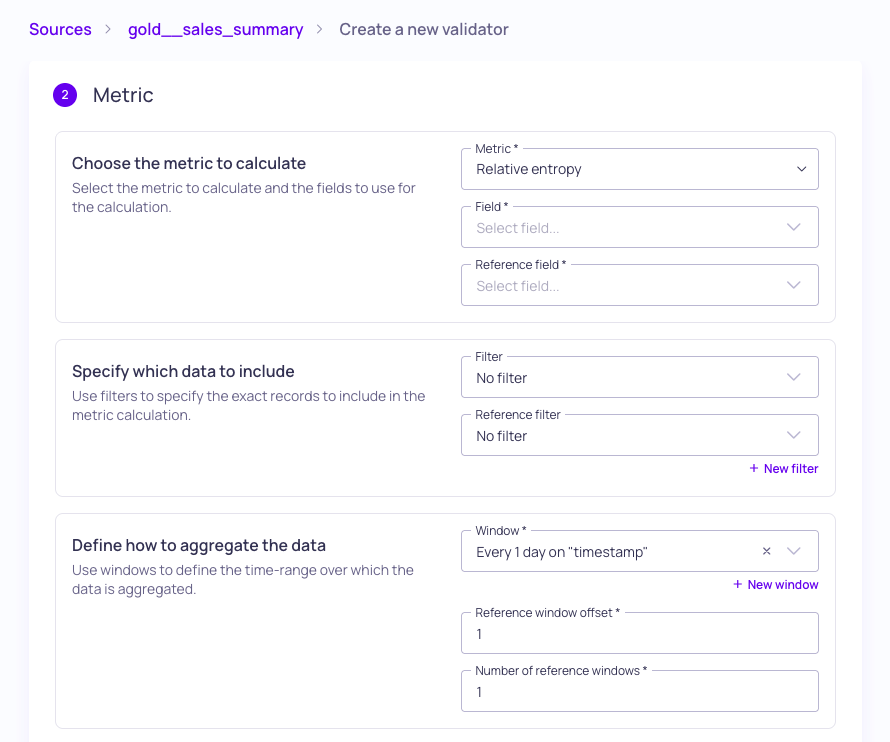
Validator metric configuration with reference parameters
Reference Field
(Required) Choose the specific field from your reference source that will serve as the comparison baseline. The reference field should contain comparable data for meaningful validation.
The field data type in the reference source must exactly match the field data type in your primary source configuration.
Reference Filter
(Optional) Apply rules to determine which data points to include in both the primary and reference metric calculation.
You can use filters to focus on specific subsets of data (such as specific regions, user types, or product categories). For example, you can filter both sources to only include users from the same geographic region when comparing user behavior metrics.
For comprehensive filtering options, see About Filters.
Window
(Required) Select a pre-configured window or define a new window to use in the metric calculation. Then, define the reference window with the window offset and number of windows parameters.
For details about types of windows and their configuration, see About Windows.
Reference Window Offset
(Required) The reference window offset shifts the reference window backward in time to compare against historical data. For example,
0= Compares the current primary window against the current reference window.1= Compares the current primary window against the previous reference window (if the window is daily, the reference window is yesterday).7= Compares the current primary window against the reference window from 7 periods ago (if the window is daily, the reference window is 7 days ago).
Timing Considerations: Reference windows remain empty until they contain data within your source's lookback time. If you set the window offset beyond your data warehouse's lookback period, the reference window may stay empty until sufficient historical data is available.
Number of Reference Windows
(Required) Aggregate metrics across multiple windows to smooth variations and reduce noise. By default, the number of windows is set to 1 for single window comparison.
Choose a number larger than 1 to compare your current data against an aggregate of the values calculated over the total number of windows. For example, setting this to 7 with daily windows compares your current day against the average of the past 7 days from your reference source.
Examples
These examples illustrate how the metric is calculated for reference sources with different daily window configurations.
Example 1
Use Case: Detect real-time sync issues between systems. For example, compare current order volumes between your production database and analytics warehouse.
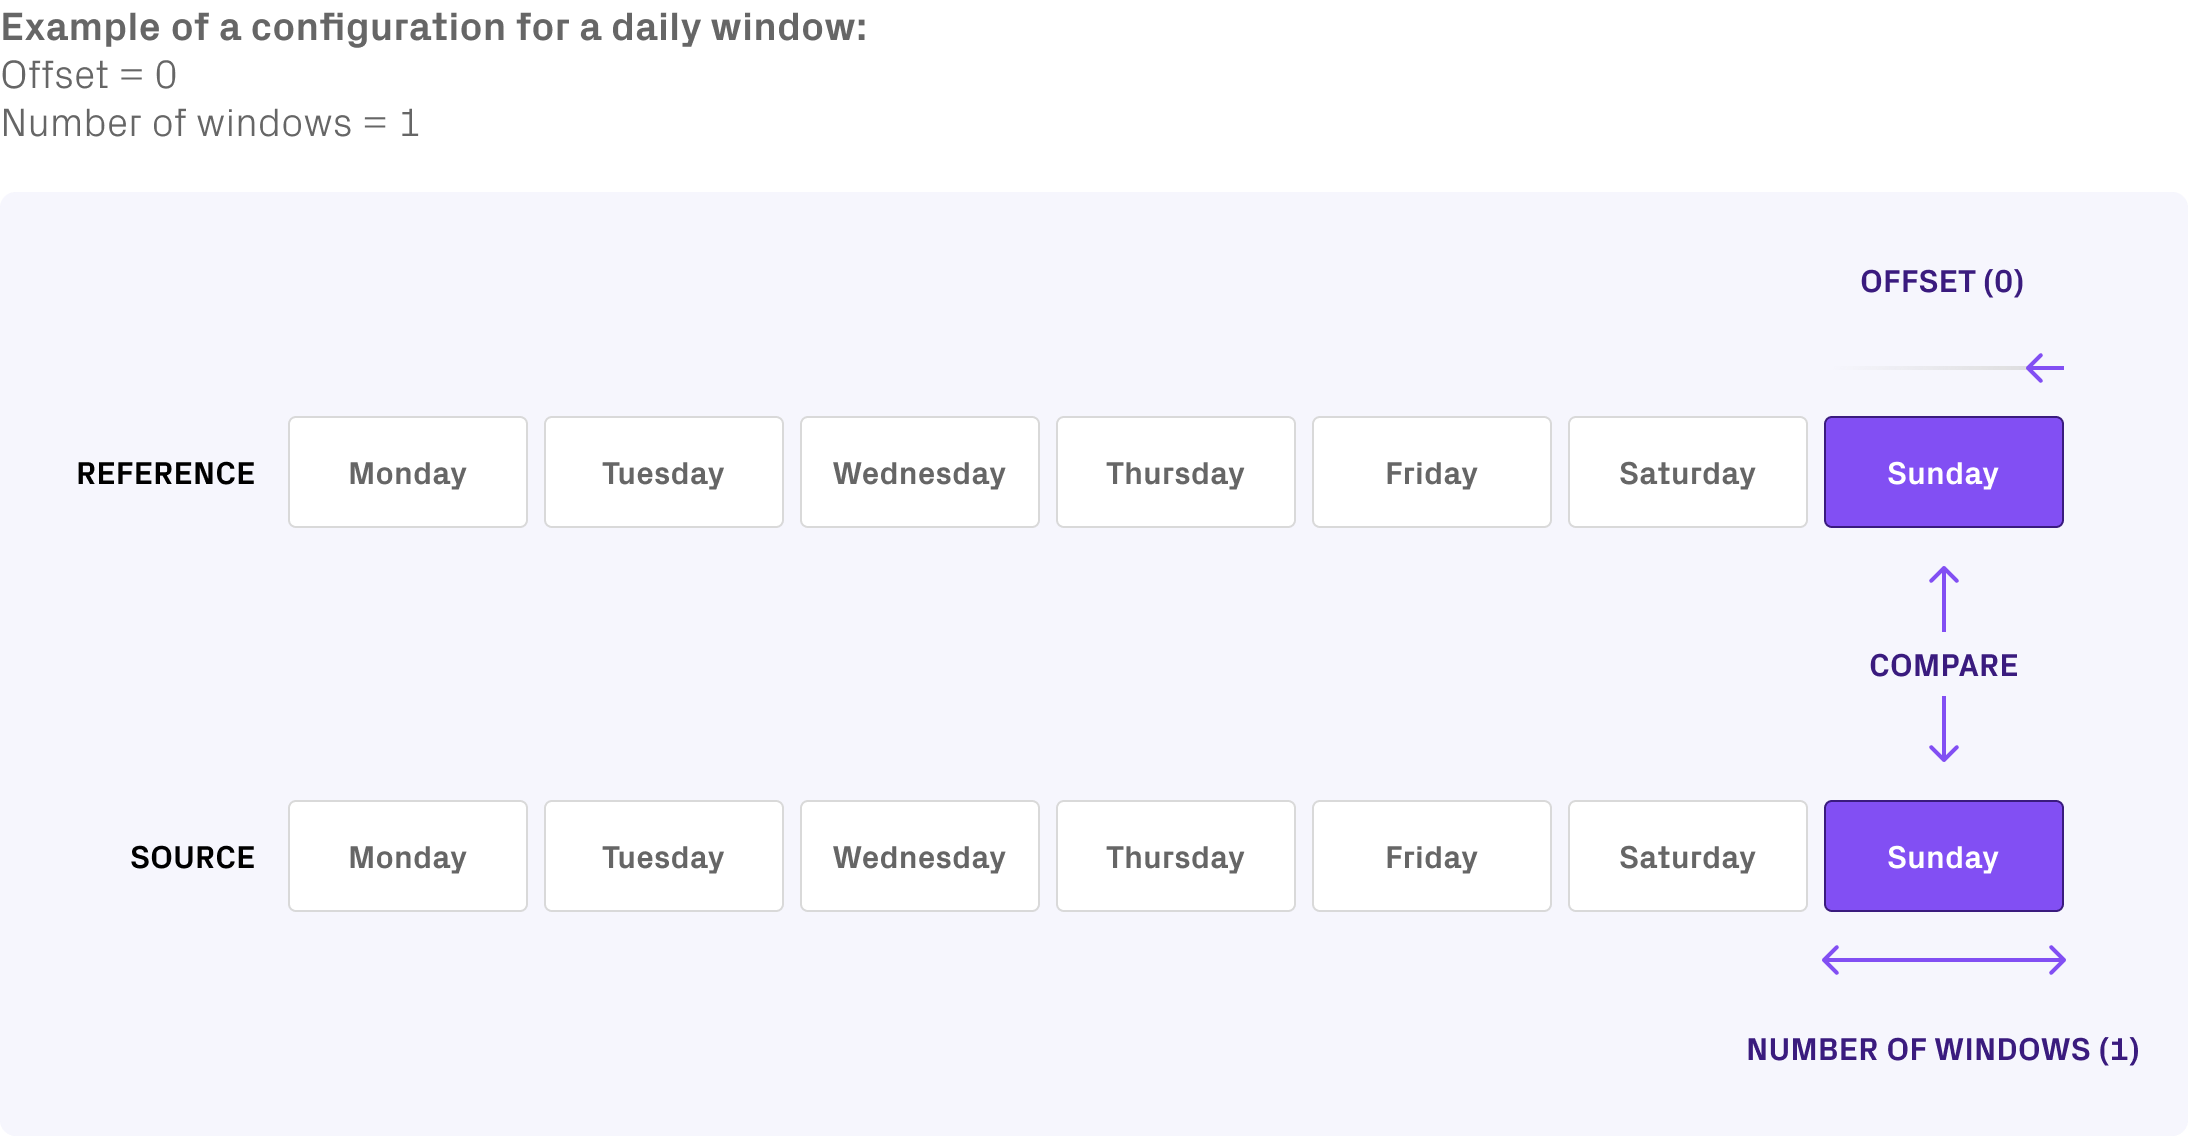
Compare current data windows between different sources to detect discrepancies in real-time.
Example 2
Use Case: Daily trend monitoring and anomaly detection. For example, compare today's user engagement metrics against yesterday's performance.
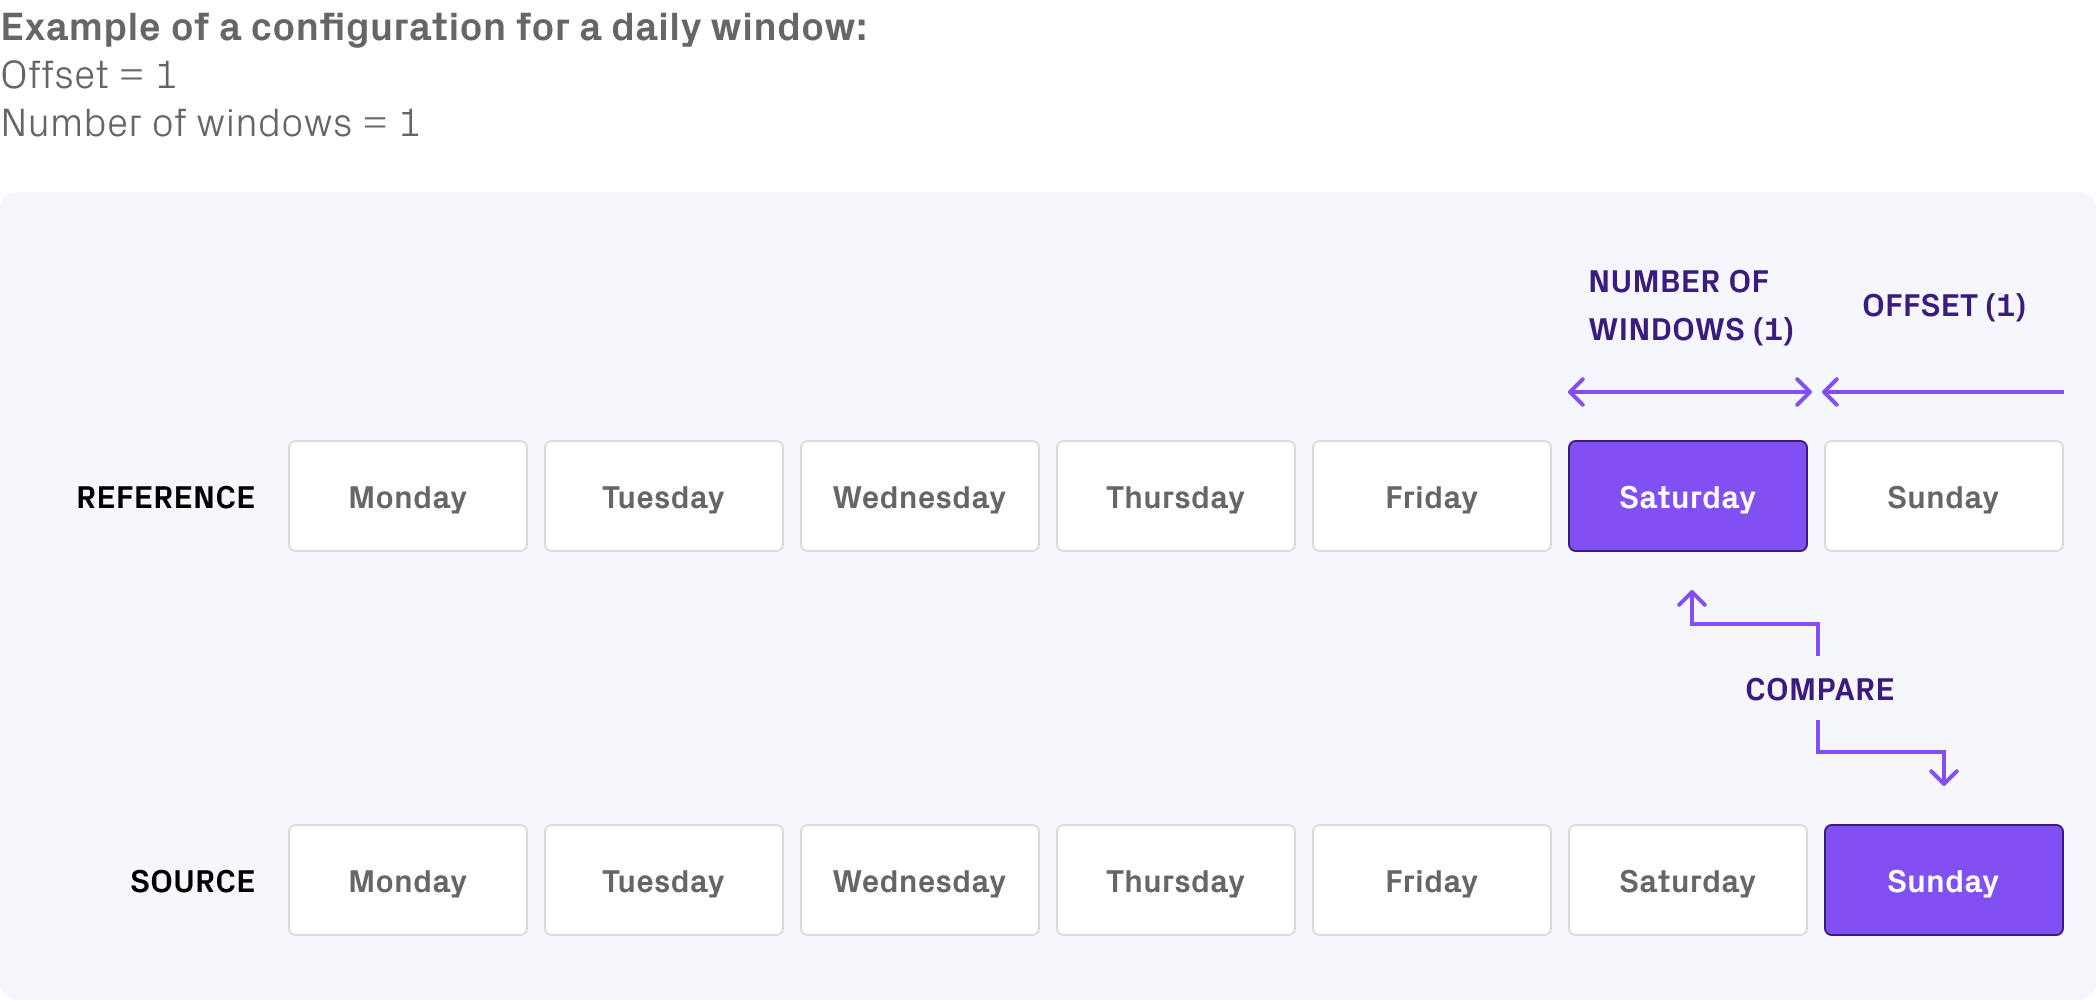
Compare current data window against metrics from previous day.
Example 3
Use Case: Weekly trend monitoring and anomaly detection. For example, compare today's metrics against last week's performance.
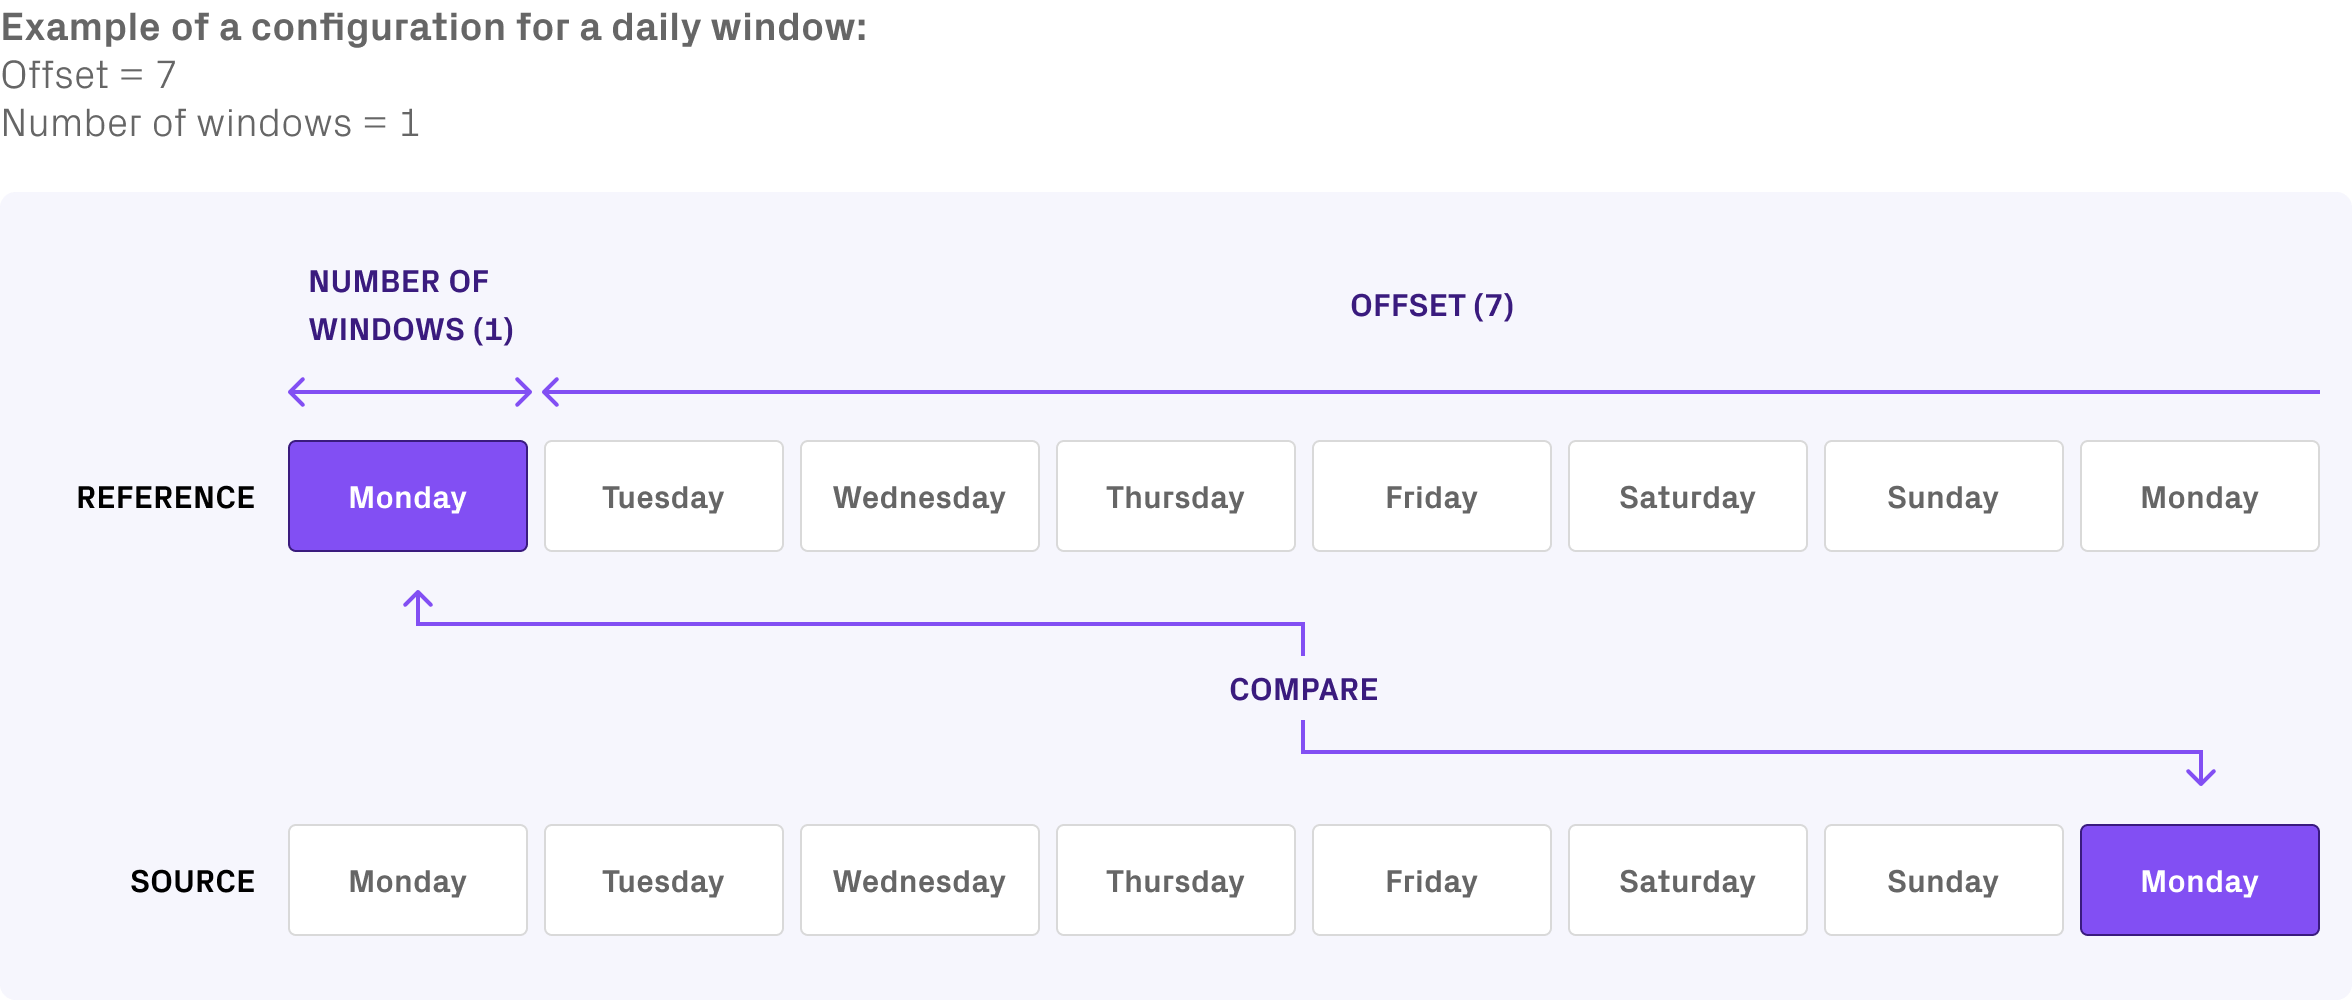
Compare current data window against metrics from a week ago.
Example 4
Use Case: Smoothed trend analysis. For example, compare the current performance against the average performance for the past week.
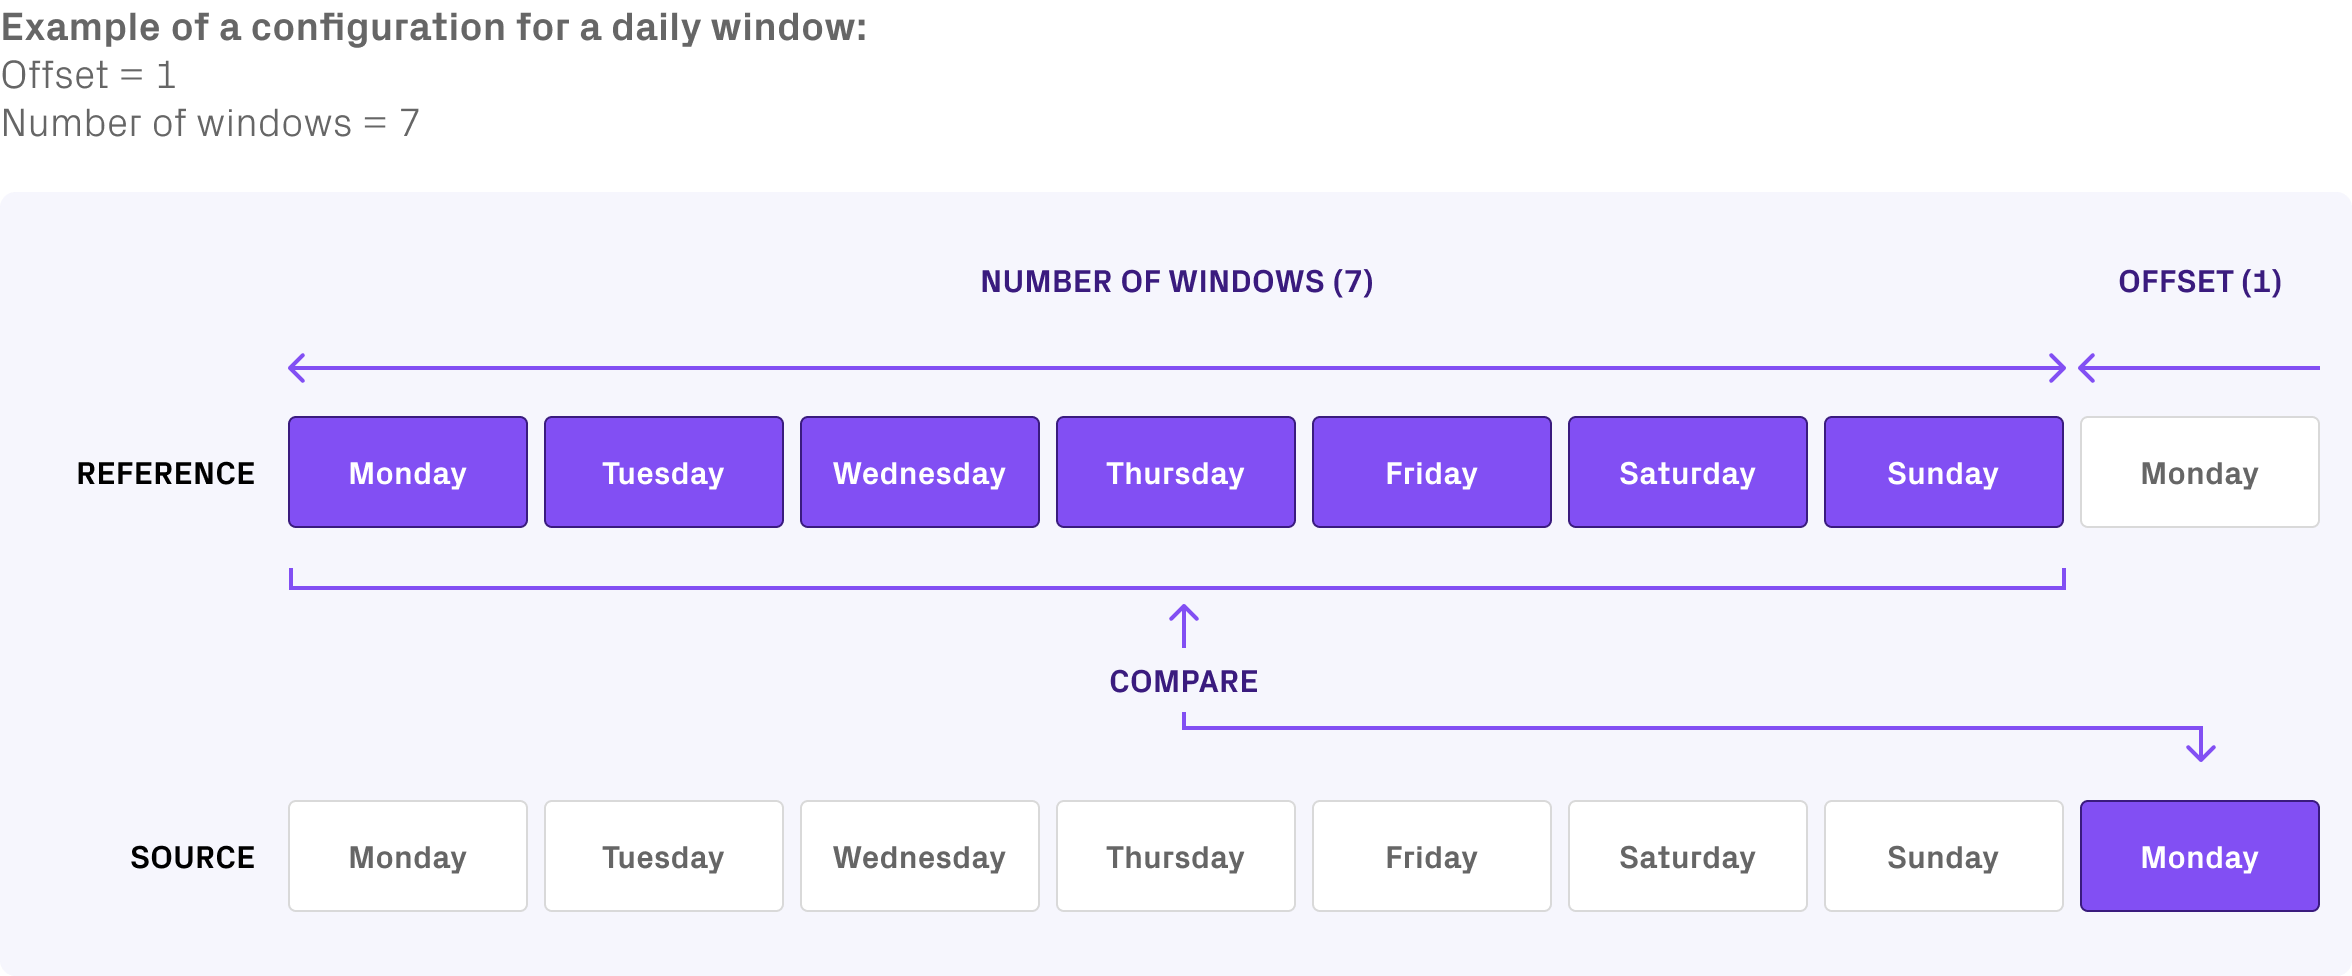
Compare current data window against aggregated weekly averages for smoother trend analysis.
Updated 5 months ago