Validio Overview Dashboard
The Overview dashboard tracks data quality, incident resolution, and recent activity across your monitored sources, with page-level filters and a time range control.
The Overview dashboard is the landing page in Validio, providing a high-level summary of data quality, incident resolution, and recent activity across all your monitored sources. Use it to scan the current state of your data, filter down to what matters, and drill into the resources that need attention. For more information about the concepts used in this dashboard, see Key Concepts.
Validio Overview Dashboard
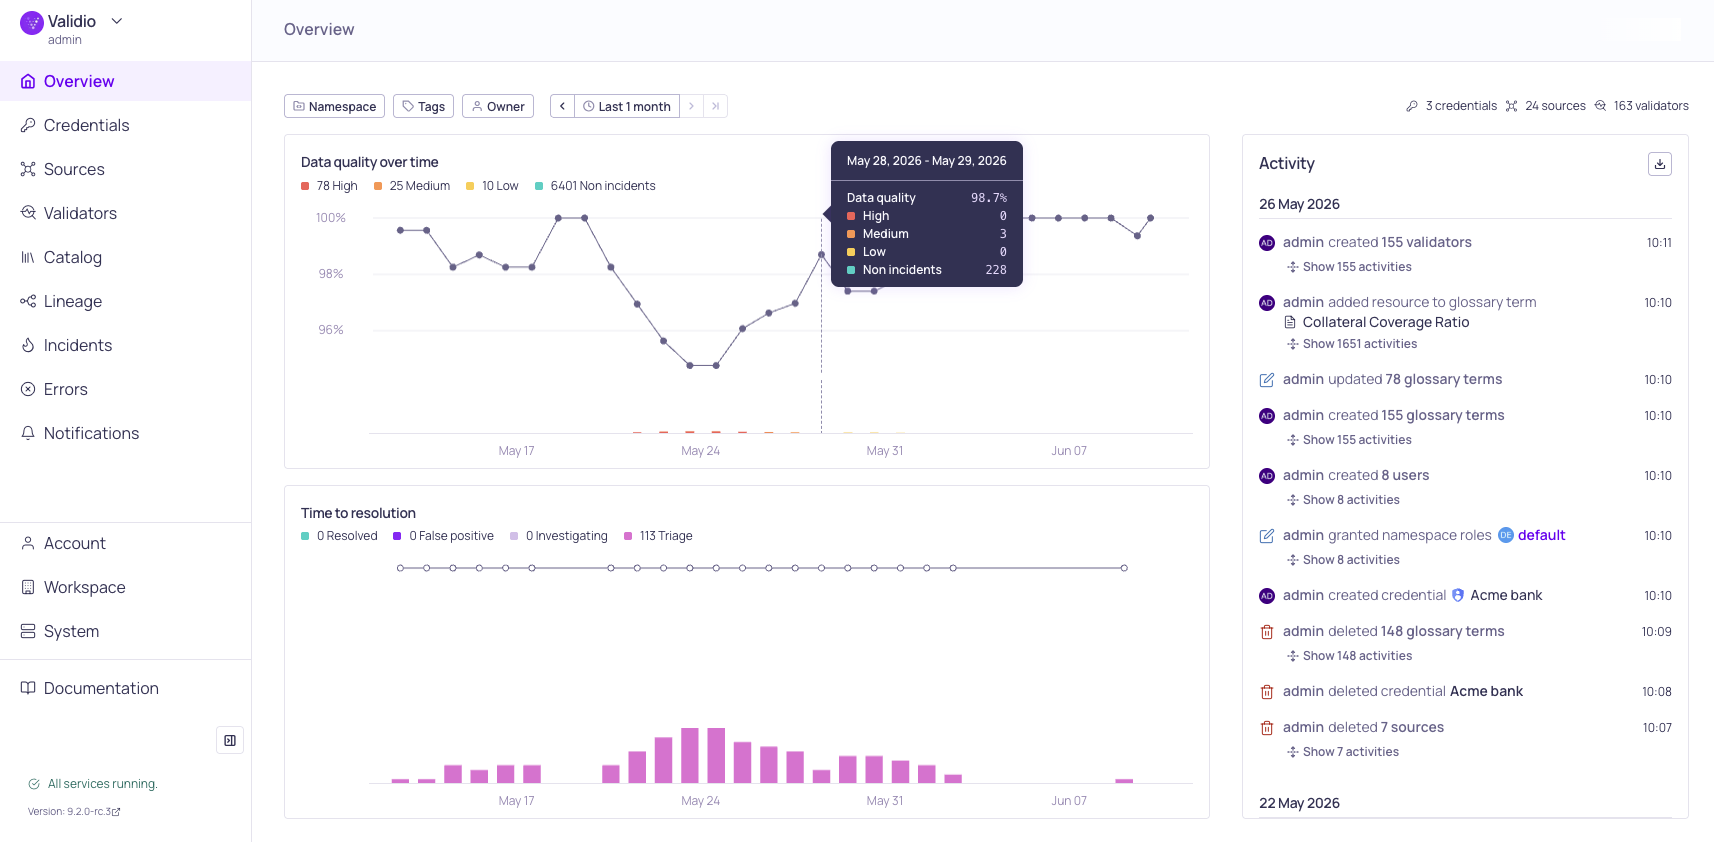
The page combines two trend graphs — Data quality over time and Time to resolution — with a running Activity panel and a set of summary statistics. Page-level filters and a time range control let you focus every widget on a specific slice of your data. You can hover the graphs for details and click through the Activity panel via resource links to investigate further.
Filtering the Dashboard
Filters appear at the top of the page and let you scope what the dashboard shows.
- Namespace — limit the dashboard to one or more namespaces.
- Tags — limit the graphs to resources with the selected tags.
- Owners — limit the graphs to incidents assigned to the selected owners.
Not every filter affects every widget. Namespace and the time range scope the entire page; Tags and Owners scope only the two graphs, not the Activity panel.
| Filter | Data quality & Time to resolution graphs | Activity panel |
|---|---|---|
| Namespace | Yes | Yes |
| Time range | Yes | Yes |
| Tags | Yes | No |
| Owners | Yes | No |
Time Range
The time range control sets the period the dashboard reports on. It defaults to the last 7 days and supports lookback of up to 365 days.
You can set the range in several ways:
- Pick a relative range (such as the last hour, day, 7 days, or 30 days) or enter a custom duration like
2h,3d, or1w. - Pick an absolute start and end date.
- Shift the window backward or forward, or jump to now, using the controls next to the range.
The selected range is saved in the page URL, so you can bookmark it or share it as a deep link.
Summary Statistics
The dashboard shows summary counts of the credentials, sources, and validators in above the Activity panel, so you can see the size of your setup at a glance. These counts reflect the selected Namespace filter.
Data Quality over Time
The Data quality over time graph shows your data quality score as a line over the selected time range, above a histogram of the incidents detected in each period.
- The line plots the data quality score as a percentage on a fixed 0–100% scale. The score excludes resolved and false-positive incidents, so it reflects only active data quality issues. When there are no active issues, the score shows 100%.
- The bars break down each period by incident severity — High, Medium, and Low — plus a Non-incidents segment for the data points that did not raise an incident.
- The legend above the graph shows the cumulative count for each category across the whole range.
- Hovering a bar shows a tooltip with that period's date range, the data quality score, and the count for each severity.
Time to Resolution
The Time to resolution graph shows how quickly your team resolves incidents, above a histogram of incident statuses over time.
- The line plots the mean time to resolution for each period. It is calculated once you set at least one incident to Resolved or False positive; until then, the line is shown dashed to indicate there is nothing to measure yet.
- The bars break down each period by incident status — Resolved, False positive, Investigating, and Triage. See Incidents for what each status means.
- The legend shows the cumulative count for each status, and hovering a bar shows that period's date range, the time to resolution, and the count for each status.
Activity Panel
The Activity panel displays a running feed of recent activity — such as creating, updating, and deleting resources, and changing incident status — grouped by day (Today, Yesterday, and so on). Each entry shows who performed the action and provides resource links so you can jump straight to the resource it describes.
The panel is scoped by the Namespace filter and the time range, but not by Tags or Owner. Select Load more to extend the window and load older activity, up to 365 days. You can also export the activity log to CSV from this panel.
The activity log respects role-based access control — you only see events for resources you have access to, and the same scoping applies to CSV exports.
For the full activity log feature, including scoped views on source and validator pages, what gets recorded, access control, and CSV export details, see Activity Logs.
Empty and Zero States
On a new instance, or when a filter matches nothing, the dashboard still renders but reflects the absence of data:
What you see with no data
- The summary statistics show zero credentials, sources, or validators.
- The Data quality over time line shows 100%, since there are no active incidents.
- The Time to resolution line is dashed until the first incident is resolved.
- The Activity panel shows an empty state until there is activity in the selected range.
Updated 14 days ago