Key Concepts & Terminology
This page contains an overview of the key conceptual parts used across the Validio platform.
Key Concepts
The concepts below are grouped by the workflow you follow in Validio — from setting up monitoring, to investigating issues, to alerting your team, and to understanding your data landscape.
Monitoring & Validation
Monitoring and validation is how you connect Validio to your data and define what healthy data looks like.
- Credentials are used to access and authenticate to your data source systems. One set of credentials can be reused to set up multiple Sources. For more information, see Credentials.
- The Catalog discovers and organizes all of your data assets in one place, surfacing utilization and quality signals so you can identify the assets that matter most. From the Catalog, you can convert important assets into monitored Sources. For more information, see About Data Catalog.
- A Source connects Validio to one source system, such as a data warehouse, data stream, or object storage — typically a single table in a warehouse or a topic in a stream. Segmentations, Windows, and Validators are all defined on a Source. For more information, see Sources.
- Segmentation lets you validate data per segment, also called a group, similar to a
GROUP BYstatement in SQL. Each Source has at least one segment, and the default Segmentation is calledUnsegmented. For more information, see Segmentation. - A Window is a subset of your data — defined as a time interval or a bucket of data — over which metrics are calculated. A Global window considers all data in the Source. Each Source needs at least one Window and can have several. For more information, see Windows.
- A Filter narrows which datapoints or records are included in a Validator's metric calculation, so you can focus validation on the data that matters. For more information, see About Filters.
- Segmentation lets you validate data per segment, also called a group, similar to a
- A Validator monitors and validates the data in a Source. It calculates a metric over a Window for the fields you choose, then compares the result against a threshold to decide what is acceptable. Each Source can have one or more Validators. For more information, see Validators.
- A Threshold defines the condition a Validator uses to flag a data quality incident. Validio supports dynamic (ML-based), fixed, and difference thresholds, depending on your monitoring needs. For more information, see About Thresholds.
Triaging Critical Incidents
When a Validator detects a problem, Validio helps you investigate and resolve it.
- An Incident is a data quality issue captured by a Validator, classified by severity as Low, Medium, or High. You review, triage, and troubleshoot incidents on the Incidents page, and each incident's status feeds the Data Quality Score. For more information, see About Incidents.
- Source Errors are operational problems on a Source — such as polling failures, invalid fields, schema changes, or segmentation limits — rather than data quality issues, which surface as Incidents. For more information, see About Source Errors.
- Lineage describes how data flows through your stack, from its origin to its final use, and powers root-cause analysis when you triage an incident. For some source types, Lineage is created automatically from a Credential or a dbt manifest file; for others, it can be created manually from a Source. For more information, see Lineage.
Alerting on Incidents
Alerting keeps your team informed when incidents occur.
- A Notification rule sends incidents to specified channels, such as Slack. Each rule can include incidents from multiple Sources. For more information, see About Notifications.
- A Notification channel is the destination attached to a Notification rule. The same channel can be reused across multiple rules. For more information, see Notification channels.
Understanding Your Data
Beyond monitoring, Validio helps you understand your data landscape. The Catalog and Lineage give you a map of what data you have and how it connects, while the features below add shared business context on top.
- The Business Glossary lets you assign shared business terms to catalog assets and schema fields, so your data carries agreed-upon meaning across teams. For more information, see Business Glossary.
- Domains organize glossary terms and catalog assets by business area — for example, Finance, Marketing, or Engineering — so ownership and context are clear. For more information, see Domains.
- Classifications tag glossary terms as Critical Data Elements, Regulatory Scope, or Data Sensitivity, so you can drive governance, compliance, and data quality coverage across your assets. For more information, see Classifications.
For definitions of additional platform terms, see Platform Terminology.
Data Quality Score
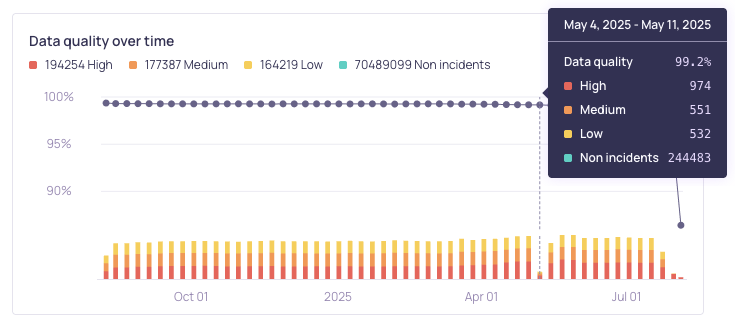
The Data quality score is a measure of the data quality and will be calculated for each Segment, Validator, and Source. On the Overview page, the quality score is presented as a percentage that shows the overall data quality across all of your Sources, taking the average over a time range.
The quality score is calculated as a fraction of the number of active incidents that you experienced during a selected time interval:
quality = 100 * (total_metric_count - active_incident_count) / total_metric_count
Active incidents are incidents that have not been resolved or marked as false positive. When you resolve an incident or mark it as not an anomaly, it is excluded from the data quality score, allowing the score to improve and better reflect the current state of your data.
A quality score of 100% represents the case where no active incidents exist during the time range — either no incidents occurred, or all incidents have been resolved. A quality score of 0% represents the case when all monitored metrics are causing active incidents. Validators with no metric results (for example, custom SQL validators that return zero rows when data is healthy) display a data quality score of 100%.
Backfill incidents
When validators are reset, rerun, or initially started with backfill, Validio processes historical data in a backfill. Administrators can enable the Auto-resolve backfilled incidents setting under Workspace > Settings to automatically resolve incidents generated during backfills. Since resolved incidents are excluded from the data quality score, this prevents historical reprocessing from negatively impacting your score. See Configuring Global Settings.
Validio assigns the following color scheme when the data quality is displayed in graphs and tables:
| Color | Data Quality Score |
|---|---|
| Green | Score equal or above 90% |
| Yellow | Score between 60% and 90% |
| Red | Score below 60% |
Time to Resolution Metrics
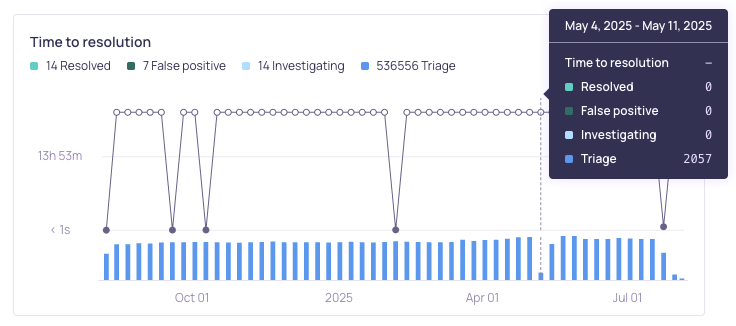
The Time to resolution graph displays a summary of the current statuses of incidents and the incident resolution over time. The Time to resolution metric is calculated when you change the status of at least one incident to False Positive or Resolved. On days when you didn't update the status of any incidents, the points will show on the graph as an open dot, and the tooltip will display a "-" to indicate that the Time to resolution value is not available. The granularity of the graph depends on the time range settings of the view.
Reads and Writes Metrics
Validio monitors interaction with all configured sources and tracks the usage and performance as Reads and Writes. You can view these metrics on the Source Overview tab.
| Metric | Description |
|---|---|
| Reads | The number of times the source is accessed, for example the number of SELECT queries, in the last 30 days. (Table views will also count as reads.) |
| Writes | The number of times the source is modified in the last 30 days. This includes the following queries: CREATE, UPDATE, DELETE, PUT, INSERT, MERGE, TRUNCATE, and so on. |
Updated 24 days ago