Reviewing Validators
Review validators on the global Validators page, Source Validators tab, and individual Validator details page.
You can review validators on the global Validators page, the Validators tab on the Source details page, or the individual Validator details page. For information about updating, muting, duplicating, or deleting validators, see Managing Validators.
Global Validators Page
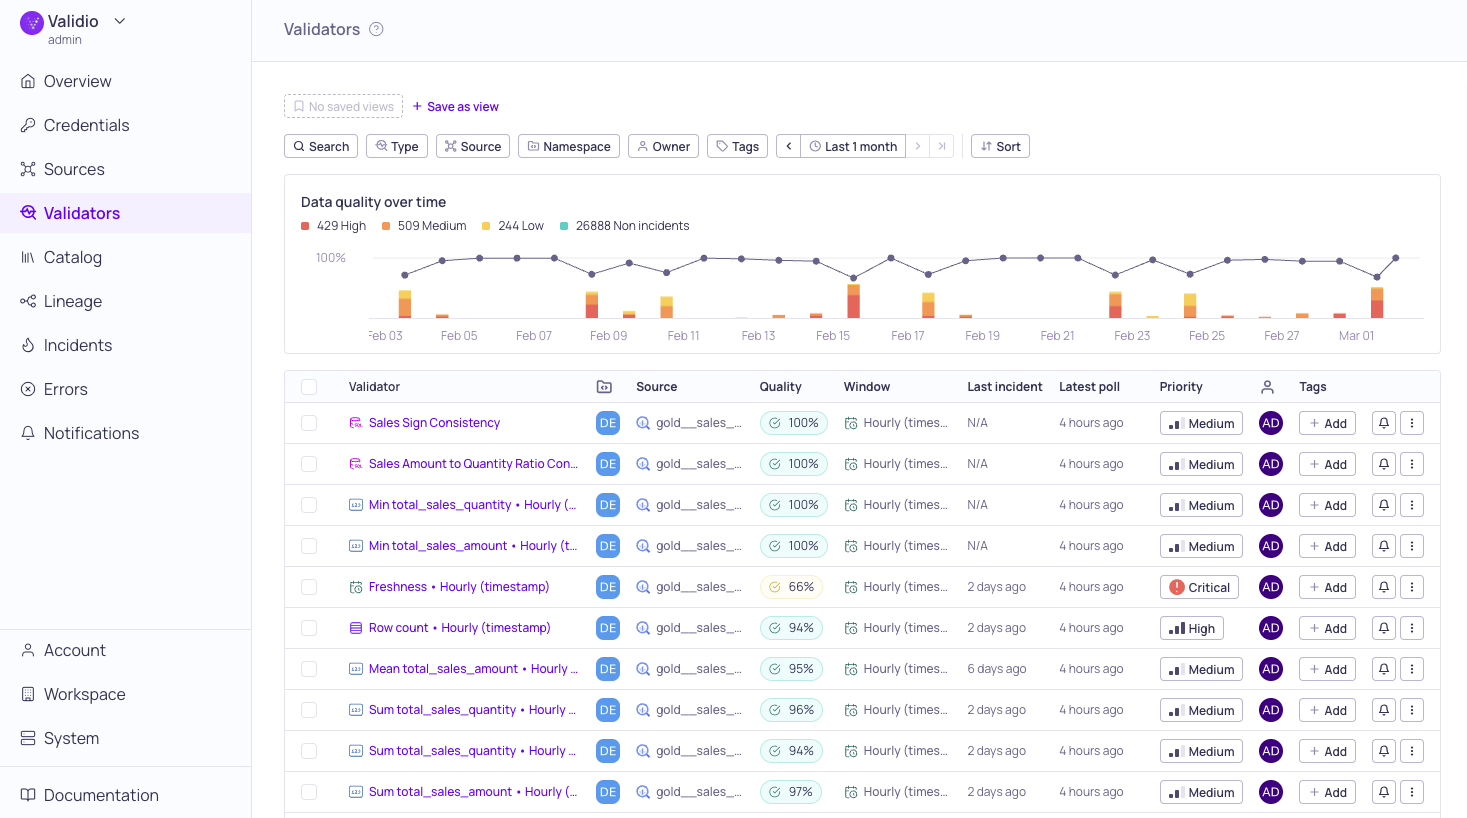
Global Validators page
To find the global validators page, click Validators in the platform navigation sidebar. The Validators page lists all of the validators that have been configured on sources that you have access to view (based on your namespace settings). This page includes the Data Quality over time graph and a list of all the validators with information about the source they are attached to, the data quality score, configured windows, assigned owners, and so on.
From this page, you can:
- If you want to see all the validators associated with a single source, click on the source name in the table to open its Validators tab. See Source Validators Tab.
- Click on a validator name to open its individual details page, where you can view more granular details. See Validator Details Page.
- Update an individual validator's configuration or mute notifications. For more information, see Managing Validators.
Source Validators Tab
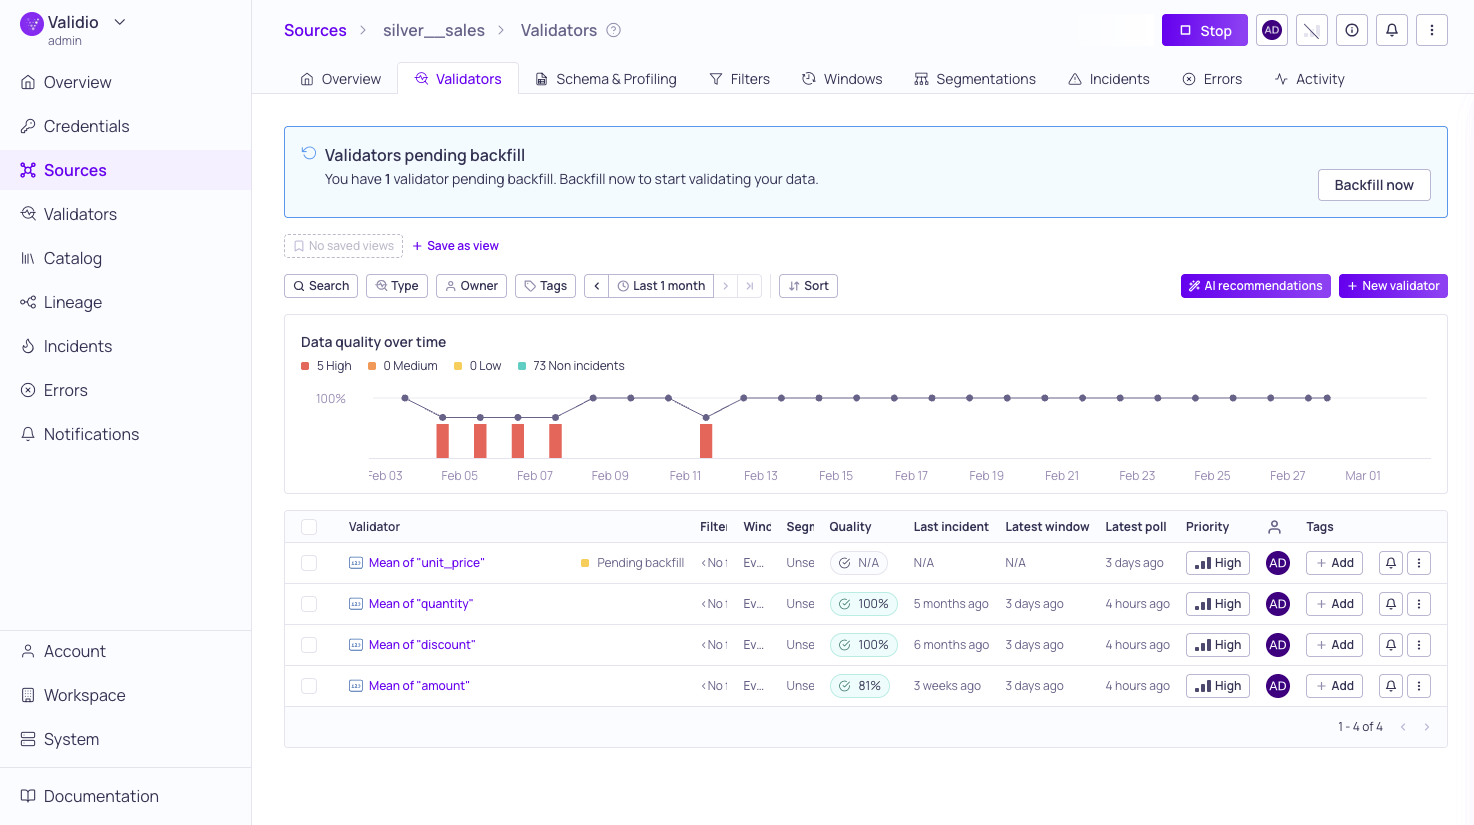
List of Validators for the silver__sales source with pending backfill
The Validators tab on a Source’s details page includes the Data quality over time graph and a list of all that validators that exist on that source. The validators table include the following information:
| Column Name | Description |
|---|---|
| Validator | The display name of the validator and an icon that indicates the type of validator. For more information, see Validator Types . This column will also display "Pending backfill" if the validator is waiting for backfill. |
| Filter | Filters that are configured on this validator. For more information, see About Filters . |
| Window | The window configured on the validator. For more information, see About Windows . |
| Segmentation | Which segmentation, if any, is applied to the validator. For more information, see Segmentation. |
| Quality | The quality score, which is calculated as a number of windows without incidents to the total number of windows. |
| Last incident | How long ago the last incident was discovered by the validator. For more information, see About Validator Incidents. |
| Latest window | How long ago data was last seen from the source. |
| Latest poll | How long ago data was last polled from the source. Displays an error if the last poll failed. |
| Priority | The importance (Critical, High, Medium, Low, None) of the validator. Incidents detected on this validator will inherit the priority. If there is no priority, incidents will inherit the source priority. |
| Owner | The user responsible for the source. |
| Tags | Tags assigned to the source. |
| Dimension | The data quality dimension the validator is tagged with (Completeness, Validity, Timeliness, Accuracy, Consistency, or Uniqueness). Validators without a dimension show "No dimension". |
From this page you can:
- Use the histogram to view a summary of incidents from all validators configured on the source.
- Search by name, and filter and sort the list of validators. Filters include Type, Source, Namespace, Owner, Tags, Dimension, and Data quality fields — see Searching, Filtering, and Saving Views and Data Quality Dimensions.
- Click + New validator to start the validator configuration wizard. For more information, see Configuring a Validator.
- For more granular details, click on a specific validator name to open its details page.
- Duplicate, update, rerun, reset, or delete validators from the ⋮ menu. For more information, see Managing Validators.
Validator Details Page
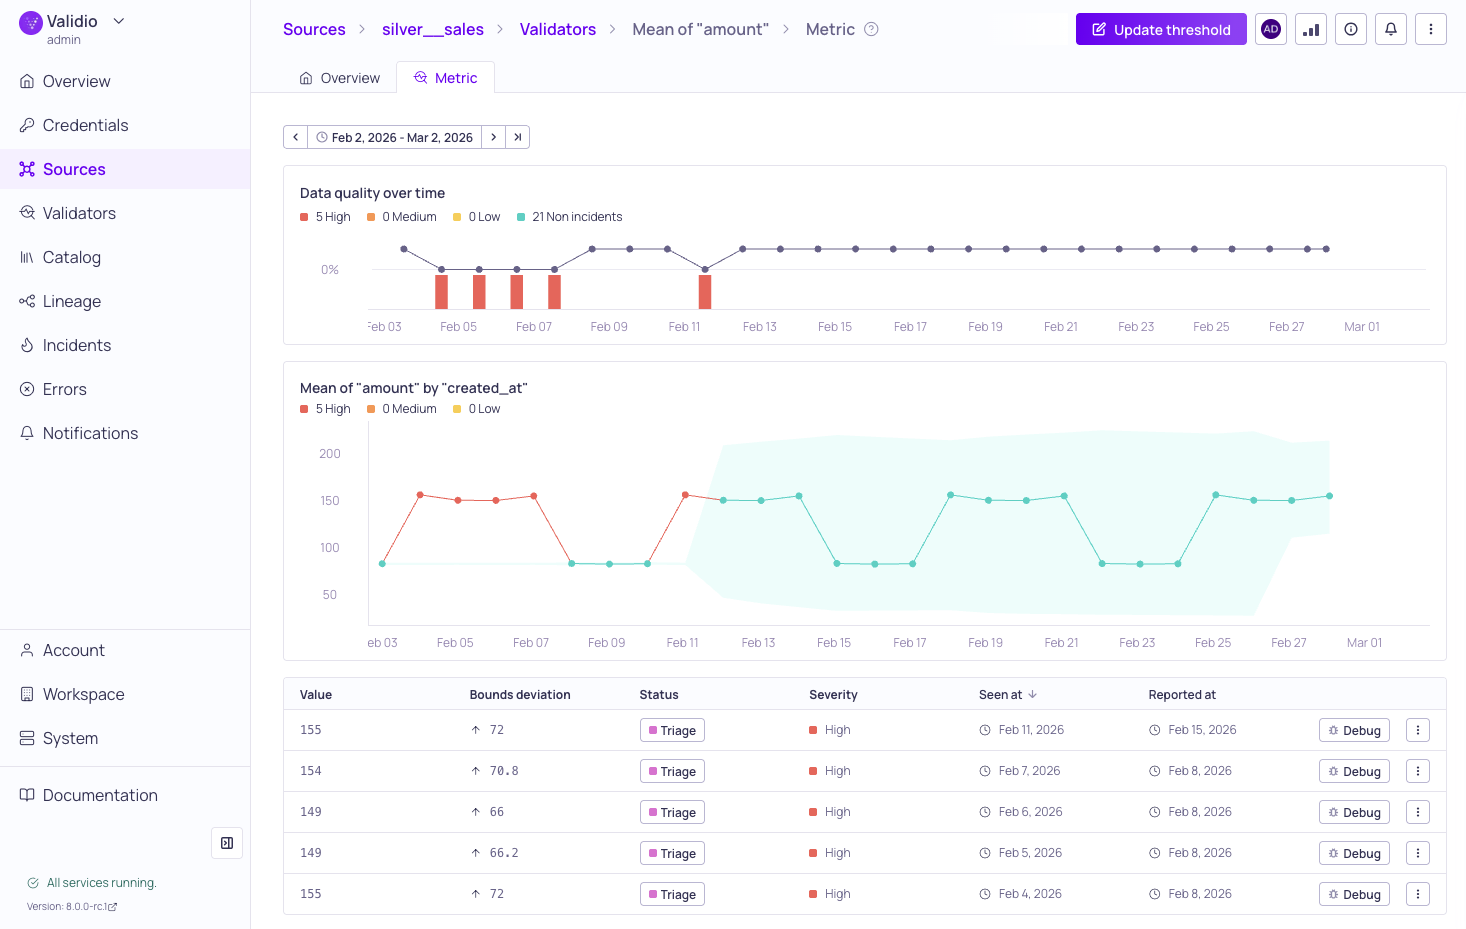
Validator details Metrics tab with incidents
A validator's details page displays information about the configuration of the validator and the incidents detected by the validator. There are two tabs under the validator details pages: Overview and Metric. By default, the validator details page opens on the Metric tab.
From the controls at the top of the page, you can manage the validator's threshold, owner, muting, rerun, and other settings. For more information, see Managing Validators.
Validator Information Panel
The validator information panel displays a summary of the validator configuration and status. From this panel, you can update the owner and priority, add or update tags, and update the description. The panel
There are two ways to open the panel:
- On the global Validators page and Source Validators tab, click the row for an individual validator.
- On the Validator details page, click the i icon.
Overview Tab
The Overview tab displays a description of the validator, Tags, and an Activity panel for all recent activities related to the validator and its metric calculations. The activity panel can be exported to CSV — see Activity Logs.
Metrics Tab
The Metrics tab displays information about the data quality and incidents that were detected by this validator. This page includes the Data Quality over time graph, the incident metrics graph, a list of detected incidents, and segment filters if you have segmentation configured on the validator.
Incident Metrics Graph
The metrics graph provides details about the values and bounds of the detected incidents, their severity, and when each was detected. In the metric graph:
- The granularity of the x-axis is determined by the window size.
- The graph updates in real-time, if new data comes in and a new window is completed. You do not need to refresh your browser window.
- Hover on a datapoint to display its detected time range, value, bounds, and severity.
- Click on a datapoint to pin the tooltip. The pinned tooltip includes processing context timestamps (Start, End, Created) and, for rerunnable validators, a Rerun from [date] button to trigger a rerun from that specific time window.
- If a datapoint has been rerun, the tooltip displays a Previous runs section showing each rerun's metric value with a severity indicator and timestamp. Rerun results also appear as secondary points on the graph connected to the original datapoint.
- For validators using dynamic thresholds, a vertical dashed line marks points where the Dynamic Threshold model changed. Hover the datapoint to see why—see Model Change Indicators.
Important
For all validators except Row Count (Volume) and Freshness validators, datapoints will not be created in the metric graphs when no data is observed.
Incidents List
The incidents list provides details about the values and bounds of the detected incidents, their severity, and when each was detected. The list includes the following columns:
| Column Name | Description |
|---|---|
| Value | The metric value with a severity indicator showing the incident severity (High, Medium, or Low). |
| Bounds Deviation | The difference between the metric value and the breached boundary. |
| Status | The progress of the incident resolution: Triage, Investigating, Resolved, or False Positive. |
| Rerun Value | The metric value from the most recent resolved rerun, shown with a green indicator. Only visible when at least one incident has been rerun. |
| Rerun At | The timestamp when the rerun was executed. Only visible when at least one incident has been rerun. |
| Seen At | When the incident was seen. |
| Reported At | When the incident was reported. |
For information about managing incidents from this list, see Managing Validators.
Updated about 1 month ago