Managing Incident Groups
Learn how to manage incident groups in Validio, including updating status and ownership.
From the global Incidents page, click an incident group name to open its Group details page. You can manage individual incidents or all incidents in a group using the group details page.
Incident Group Actions
At the top of the page, you have buttons for bulk actions on all incidents in the group:
- Owner–Update or assign ownership to a user who will manage and resolve the incident group.
- Status–Update the incident group status to track its progress towards resolution.
- Mute–Silence repeated notifications from this incident group for a period of time or until you click Unmute. For more information, see Muting Incident Notifications.
Notification Rules
If you have notification rules to track when an incident occurs, the notification includes a link directly to the Incident details page where you can manage it.
Update the Incident Owner
The ownership of sources and validators default to the user who created the resource. Incident groups will automatically inherit the owner based on the validator that detected the incident, if that validator has an owner. You can then update and assign a new owner to the incident group during investigation and triage.
Update the Incident Status
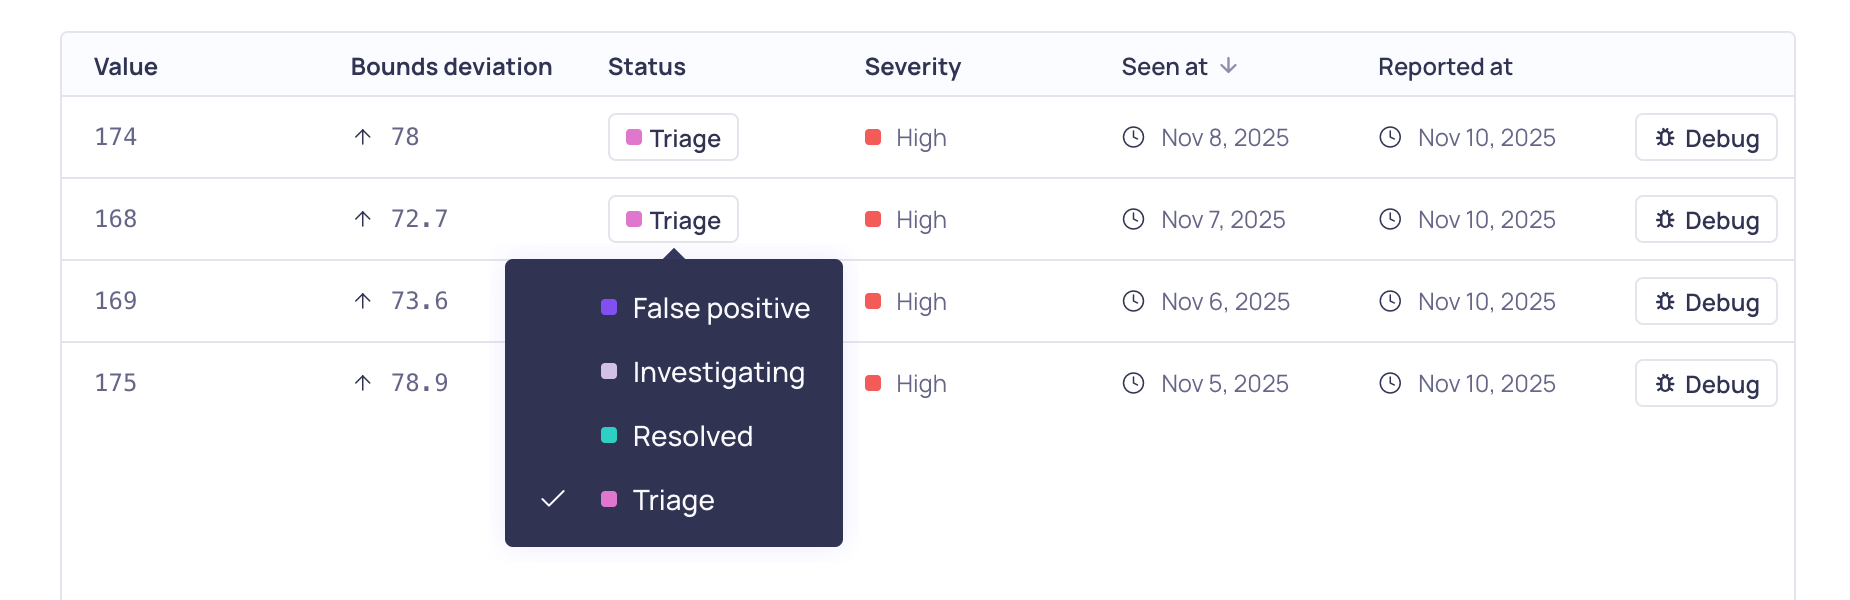
Incident Status options
You can use the incident status to track the progress of the incident resolution and retrain the anomaly detection algorithms.
The following table lists the available status options:
| Status | Description |
|---|---|
| Triage | The default for new incidents and indicates that it requires review. |
| Investigating | The incident is currently being addressed. |
| Resolved | The incident has been resolved. |
| False Positive | The incident has been addressed and is not an anomaly. |
Model Retraining
Changing the status of a detected incident to False Positive, provides feedback to retrain the anomaly detection algorithms so that it is less likely to wrongly detect similar data points as incidents when they occur in the future. This feedback cannot be undone. For more information, see Model Feedback and Retraining.
Group Overview Tab
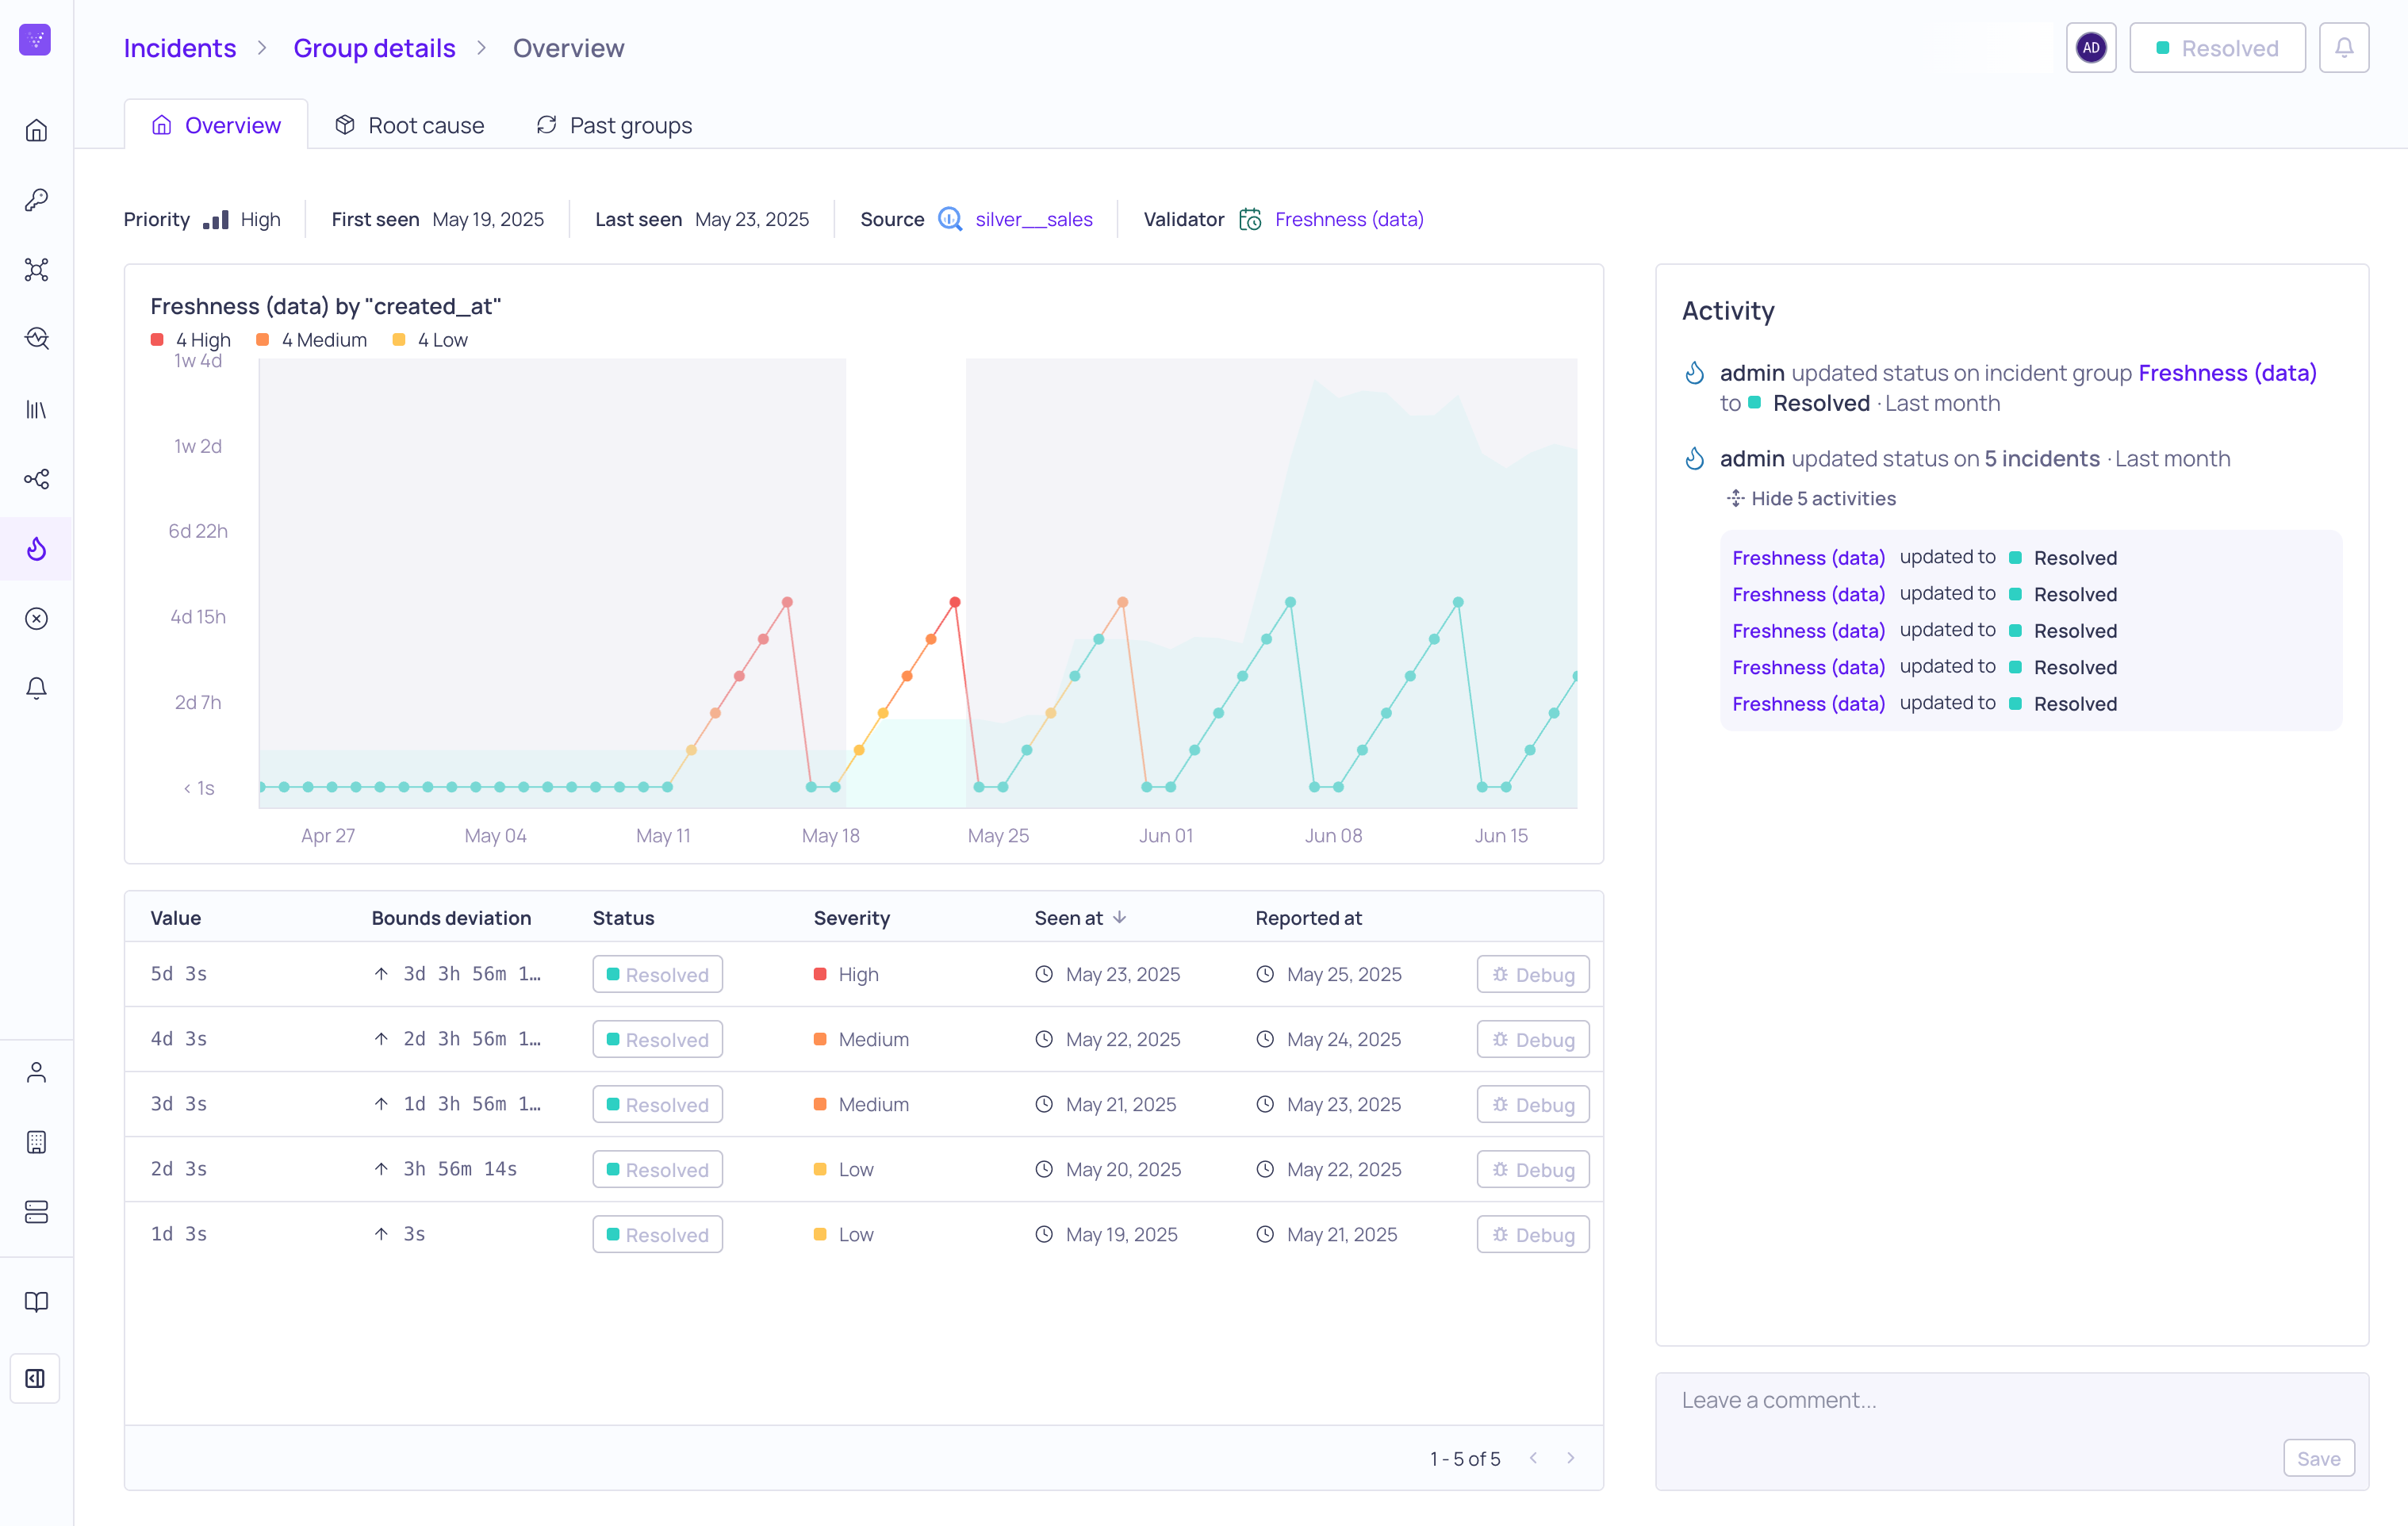
Incident Group Details Overview Tab
The Group Details > Overview tab provides a comprehensive summary of the incident, including the current status and owner, with a graph showing the validator metric values over time and a table of the individual incidents. The Overview also displays a log of activities, which includes when the incidents were reported, how many incidents were reported, and a timeline of comments that have been added to the group.
The group summary includes the following information:
| Field | Description |
|---|---|
| Priority | The priority (Critical, High, Medium, Low, None) is inherited from the priority of the source or validator. |
| First Seen | The date when the first incident in the group occurred. |
| Last Seen | The date when the last incident in the group occurred. |
| Source | The source where the incident occurred. You can click on the source to navigate to its details page. |
| Validator | The validator and metric that captured the incident. You can click on the validator to navigate to its details page. |
Metric Graph
The metric graph displays a history of the field values tracked by the validator. You can see when the incident occurred and the values before and after the incident.
The graph includes information about the severity of the incidents (High, Medium, Low) and a count of the occurrences of each severity. When you hover on a datapoint in the graph, a tooltip will display the time that the incident occurred, its Value, and its Upper and Lower boundaries. Click on a datapoint to pin the tooltip and view additional details including processing timestamps. If a datapoint has been rerun, the pinned tooltip shows a Previous runs section with each rerun's metric value and timestamp. Rerun results also appear as secondary points on the graph. For validators using dynamic thresholds, a vertical dashed line marks where the Dynamic Threshold model changed; hover the datapoint to see why—see Model Change Indicators.
Incident Table
The incident table lists the individual incidents in the group and includes the following information:
| Column Name | Description |
|---|---|
| Value | The metric value with a severity indicator showing the incident severity. |
| Rerun Value | The metric value from the most recent resolved rerun, shown with a green indicator. This column is only visible when at least one incident in the group has been rerun. |
| Rerun At | The timestamp when the rerun was executed. This column is only visible when at least one incident in the group has been rerun. |
| Bounds Deviation | The prominence of the incident, defined as the difference between Value and the breached boundary. |
| Status | The progress of the incident resolution: Triage, Investigating, Resolved, or False Positive. |
| Severity | The severity of the incident: High, Medium, Low. |
| Seen At | Relative time when the incident was seen. |
| Reported At | Relative time when the incident was reported. |
You can use the Debug button to find information to help you troubleshoot the incident. The information that you see depends on the type of source. Debug is not available for all source types. For more information, see Debugging an Incident.
Comments and Activity Log
The Activity log records all actions and updates made to incidents in the group during your investigation. These actions include status updates, changes to owners, validator reruns, and comments. Adding comments to document your findings, actions taken, or resolution creates a clear record for anyone else who joins the investigation and for future occurrences of similar incidents. For more information, see Commenting on Incidents. For the activity log across all resources in Validio, see Activity Logs.
Root Cause Tab
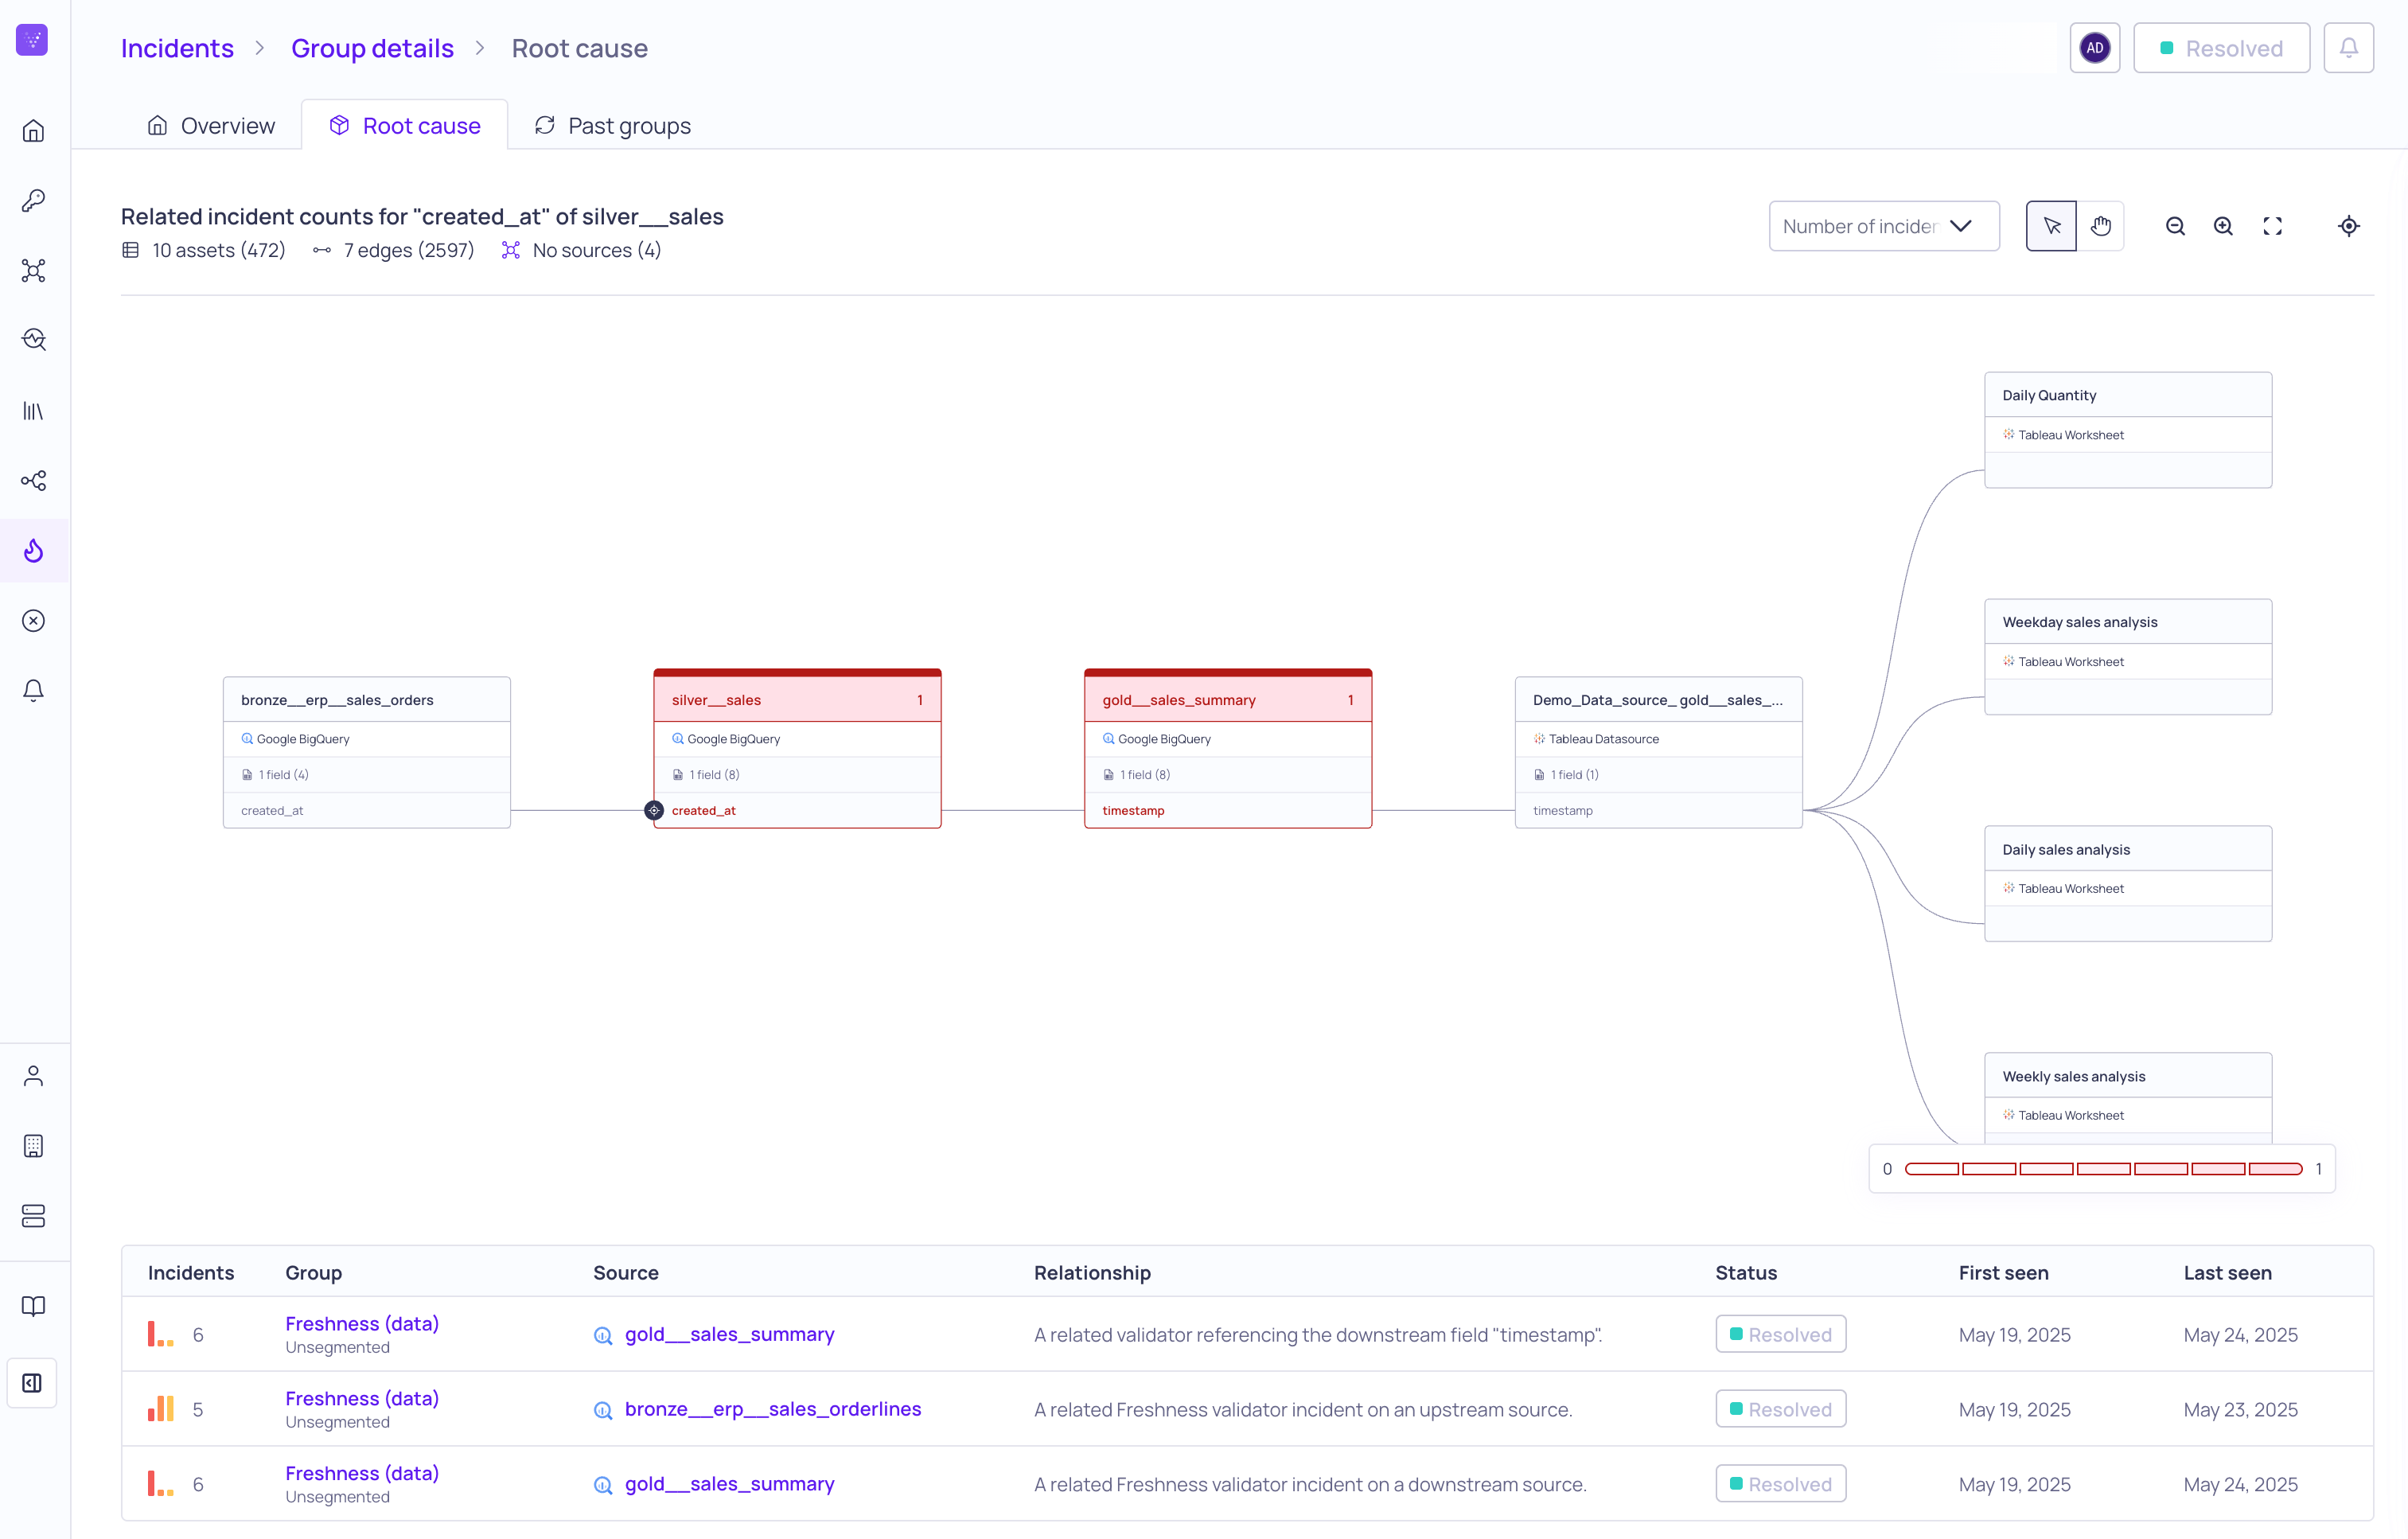
Incident Group Details Root Cause tab
The Group Details > Root Cause tab provides an analysis of the current incident group to help you troubleshoot and resolve the incident. Root cause uses data lineage to trace where the incident occurs, what causes it, and its impacts on related upstream and downstream assets. Validio uses information from these incident groups to identify causal and correlational relationships among them.
For more information, see Root Cause Analysis.
Past Groups Tab
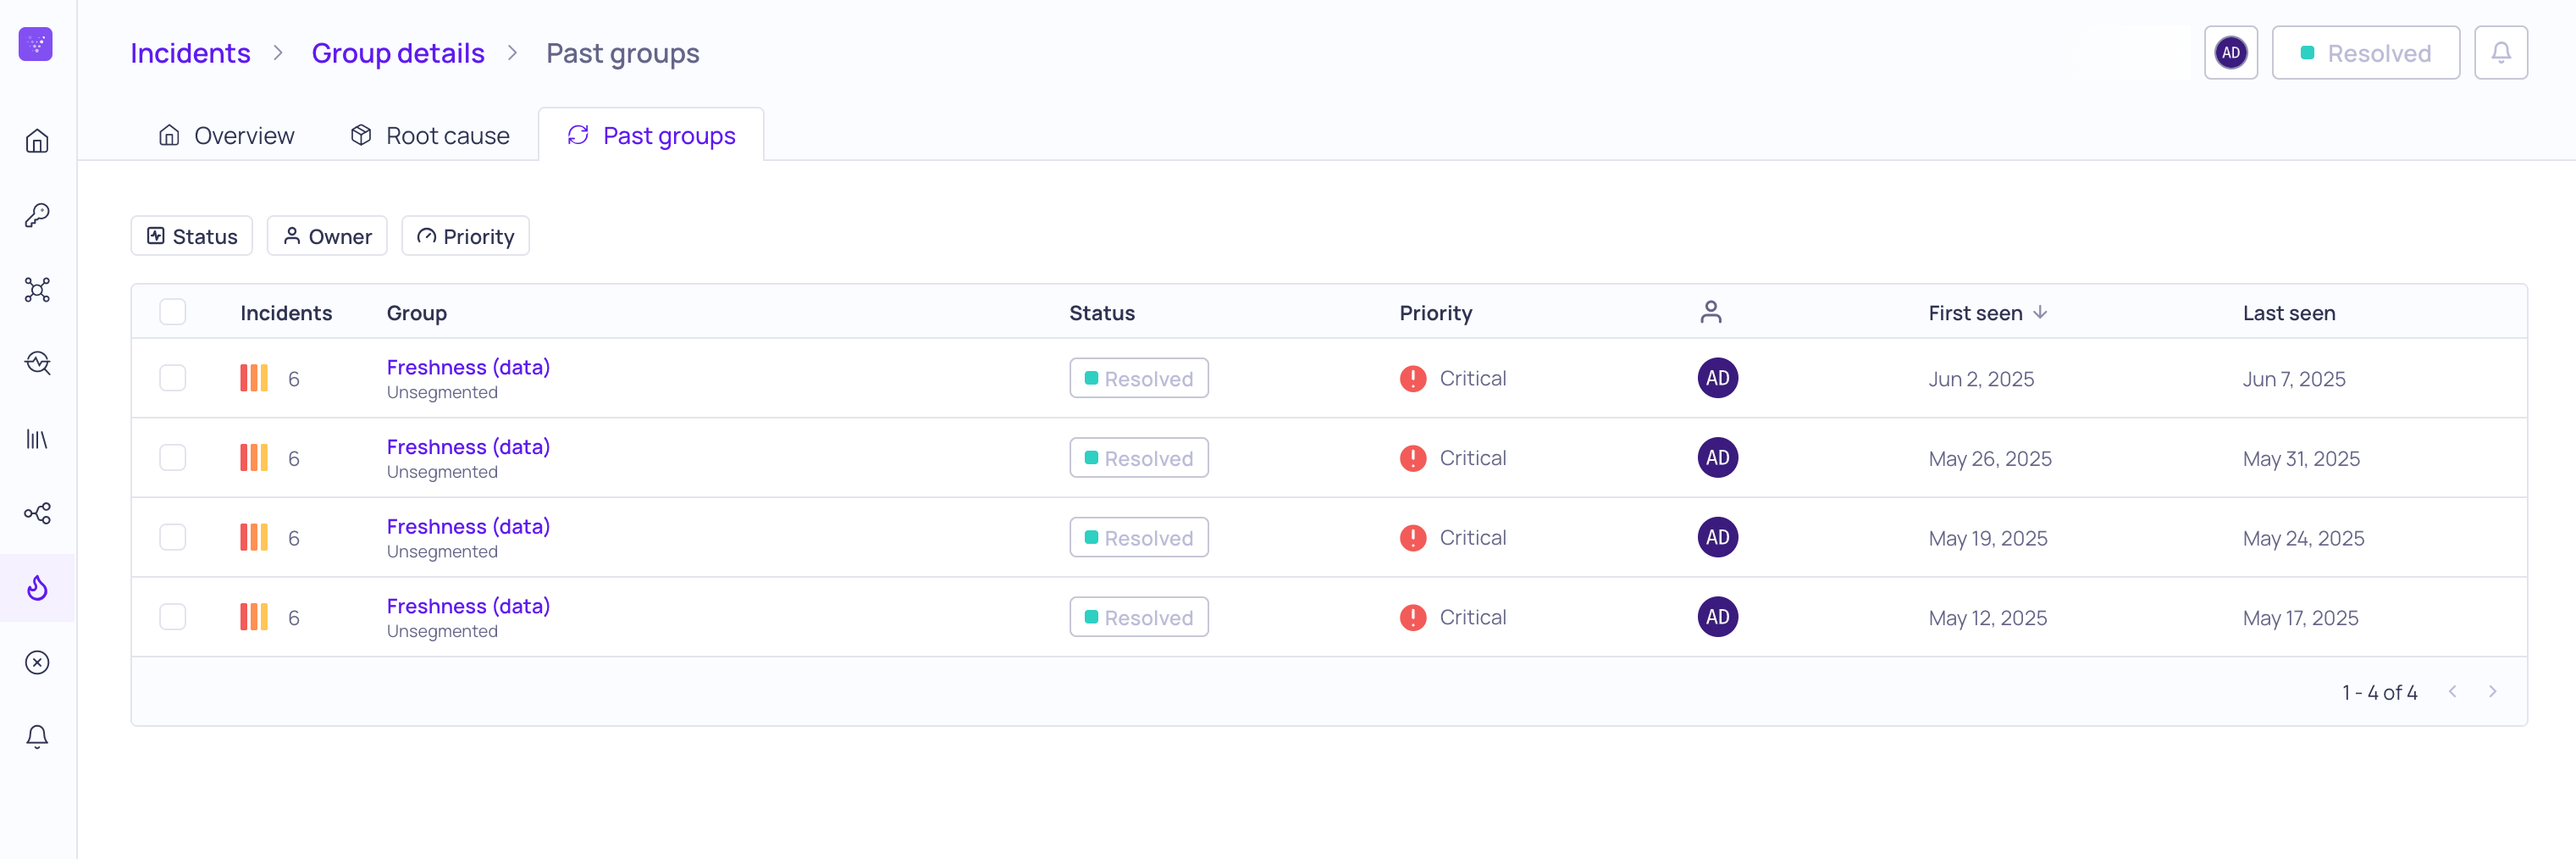
Incident Group Details Past Groups tab
The Group Details > Past Groups tab provides a list of past occurrences of similar incident groups, to give context on how often the same incident has been seen and whether it happens at a regular frequency. You can also use this tab to perform batch operations on all similar incident groups.
Updated about 2 months ago