Using Lineage
Navigate and interact with the Validio Lineage page to explore data flow, manage anchors, assign glossary terms, and inspect assets.
The Lineage page displays an interactive graph that visualizes how data flows through your data pipelines. The graph presents data flow from left to right, with upstream entities to the left and downstream entities to the right.
The Lineage page has two tabs: Assets (described on this page) and Domains (see Using Domain Lineage). The active tab is persisted in the URL so you can share links to a specific view.
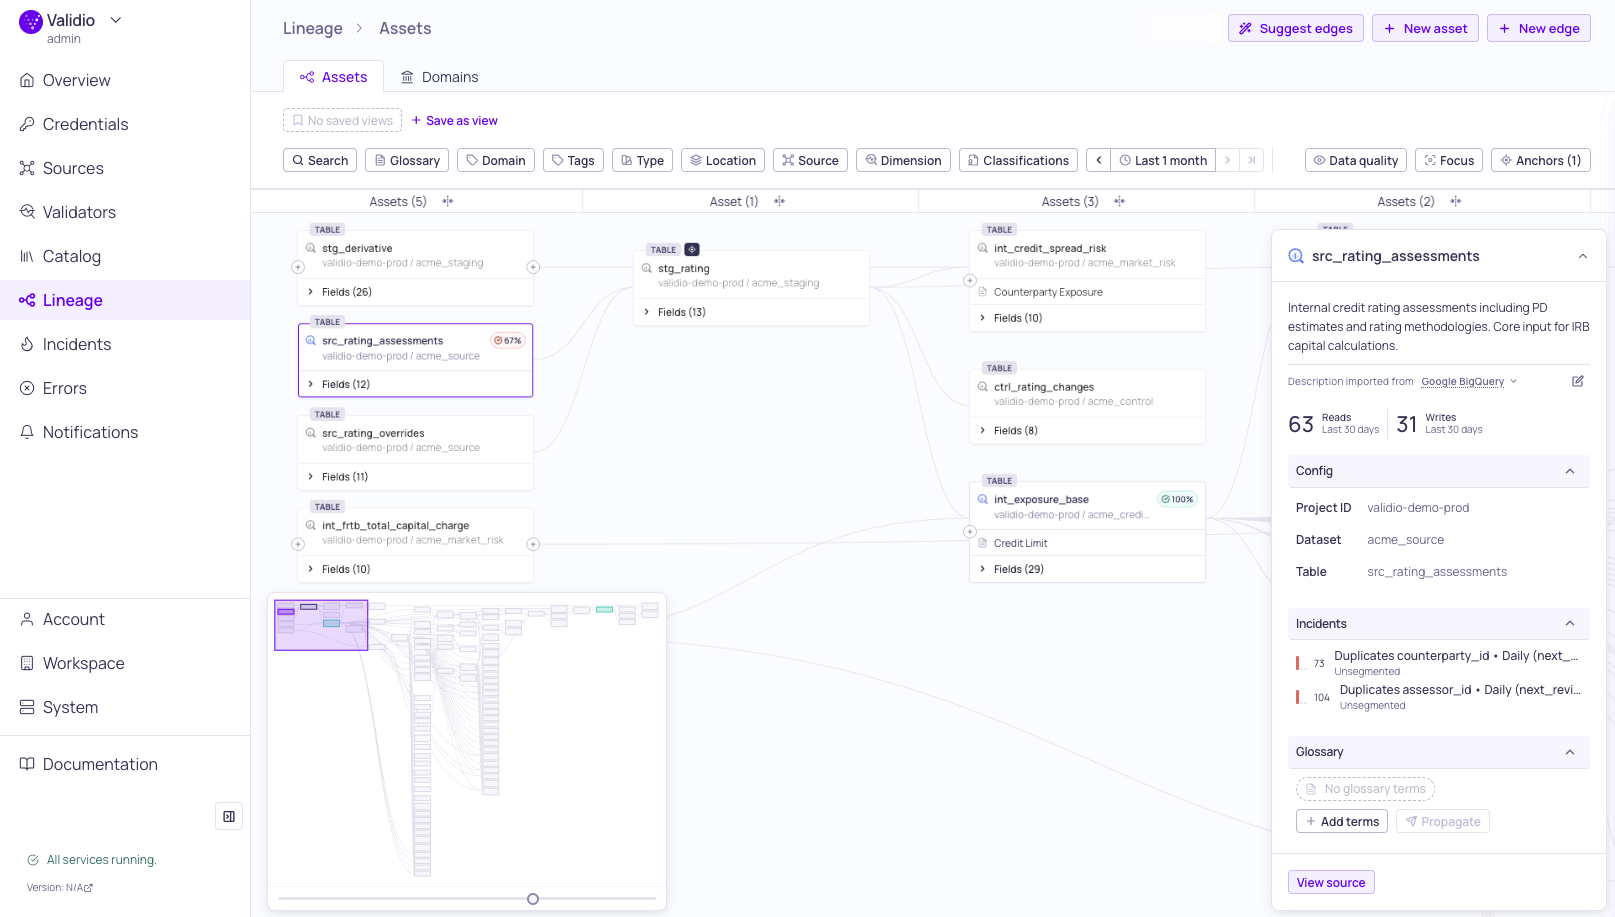
Lineage graph with sidebar
Set Anchors
Anchors are the starting points for lineage exploration. They define which assets or fields to load into the graph.
The Anchor Dialog opens automatically when you first visit the lineage page or when no anchors are set. You can also open it by clicking Anchors (N) in the page header.
The anchor dialog has two tabs:
- Assets -- Search and select catalog assets as anchor points.
- Fields -- Search and select individual fields as anchor points.
Both tabs support filtering by glossary terms, domains, types, and source.
To set anchors:
- Open the anchor dialog and click Edit.
- Search for assets or fields by name.
- Click the + icon next to each item to add or remove it as an anchor.
- Click Apply anchors to load the graph.
You can also toggle anchors directly from the lineage graph by selecting a node or field and clicking Set as anchor in the status bar.
Navigate the Graph
| Action | How |
|---|---|
| Pan | Click and drag on empty canvas. Includes inertia for smooth scrolling. |
| Zoom | Mouse wheel, or use the zoom slider in the minimap. |
| Minimap | Drag the viewport rectangle in the bottom-right minimap to navigate. |
| Expand connections | Click the expand button on a node to load additional upstream or downstream connections. |
| Collapse layers | Click a layer header to collapse it. Use "Collapse all" or "Expand all" for bulk operations. |
Select and Inspect
Click on items in the graph to select and inspect them. When an item is selected, a sidebar opens with contextual details and actions.
Selection state is persisted in the URL, so you can share links to specific lineage views.
Sidebar Details
- Nodes -- Click an asset node to select it. The node sidebar displays asset details, schema, and a glossary terms section for managing assignments.
- Fields -- Click a field row within an expanded node. The Schema field sidebar displays field details and glossary terms section.
- Edges -- Click a connection line between nodes. The edge sidebar shows upstream and downstream connection details.
Sidebar Actions
For Nodes and Fields
| Action | Description |
|---|---|
| Locate | Center the viewport on the selected item. |
| Set as anchor | Add or remove the item as an anchor point. |
| Propagate | Propagate glossary terms to connected items. Only enabled when the selected item has terms assigned. |
| More info | Open the sidebar with full details. |
| Clear | Deselect the item. |
For Edges
| Action | Description |
|---|---|
| Go upstream | Navigate to the upstream end of the connection. |
| Go downstream | Navigate to the downstream end of the connection. |
| Edit description | Open the edge sidebar to add or edit a markdown description for the connection. |
| Delete edge | Remove the manual connection. |
| More info | Open the sidebar with edge details, including the description and endpoint information. |
Focus Mode
Focus mode isolates lineage paths connected to a selected item, hiding unrelated nodes and edges to reduce visual clutter. It traces the full chain of transitive dependencies, which is useful for isolating a specific field's lineage from parallel processing paths.
To activate focus mode:
- Select a node or field.
- Click Show connected only in the toolbar to activate focus mode.
- The graph re-layouts to show only connected paths.
- Click the button again or clear the selection to exit focus mode.
When focusing on a field, the graph shows only field-level lineage paths for that specific field.
Filter the Graph
Use the filter toolbar to highlight or narrow down the graph:
| Filter | Description |
|---|---|
| Search | Free-text search on node names. |
| Glossary term | Select terms present in the graph. Matching fields are individually highlighted. |
| Domain | Select domains present in the graph. |
| Tag | Select tags present in the graph. Supports ANY OF, ALL OF, and NONE OF operators. |
| Type | Filter by asset type (e.g., BigQuery Table, Snowflake View). |
| Location | Filter by database.schema paths present in the graph. |
| Source | Boolean filter for whether the asset is a Validio monitored source. |
Matching nodes are shown in normal colors while non-matching nodes are dimmed. Click Clear to remove all filters.
Overlay data (data quality and incidents) reflects the time range selected in the page toolbar. Adjust the time range to narrow the overlay to a specific period.
Save Custom Views
Save your current anchor and filter combination as a named search to quickly return to specific lineage views.
- Configure your anchors and filters.
- Click Save as view above the filter toolbar.
- Enter a name for the saved view.
Saved views are available workspace-wide and include anchors, filters, and search text. For more information, see Customizing and Saving Views.
Glossary Terms in Lineage
Glossary terms are visible directly on nodes and fields in the lineage graph:
- Nodes show assigned terms as chips below the header.
- Fields show terms inline.
- Propagated terms are visually distinguished from manually assigned terms.
Assign Terms from Lineage
Select a node or field, open the sidebar, and use the glossary terms section. For more information, see Glossary Term Assignments.
Propagate Terms to Connected Items
Select a node or field with terms assigned and click Propagate in the status bar. For more information, see Glossary Term Propagation.
Filter by Glossary Term
Use the Glossary term filter in the toolbar. This highlights nodes and fields with matching terms while dimming the rest.
Add Assets and Connections Manually
You can add assets that are not automatically discovered — for example, tables from databases without a native Validio integration — and create lineage relationships between any assets in the graph.
Looking for AI-powered matching?
If you need to connect fields between two assets from different systems and field names may differ, use Suggest Lineage Edges to automatically discover matches using heuristic and LLM-based analysis.
To add a new asset:
- Click + New asset in the toolbar.
- Enter the asset Name and Description.
- The asset appears as a new node in the graph.
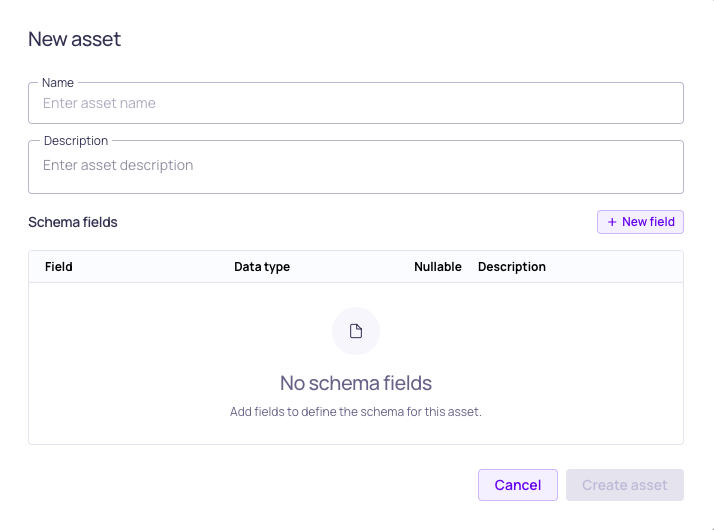
New asset configuration
To connect assets:
- Click + New edge in the toolbar.
- Search for and select the upstream assets or fields.
- Search for and add one or more downstream targets.
- Click Connect to create the edges.
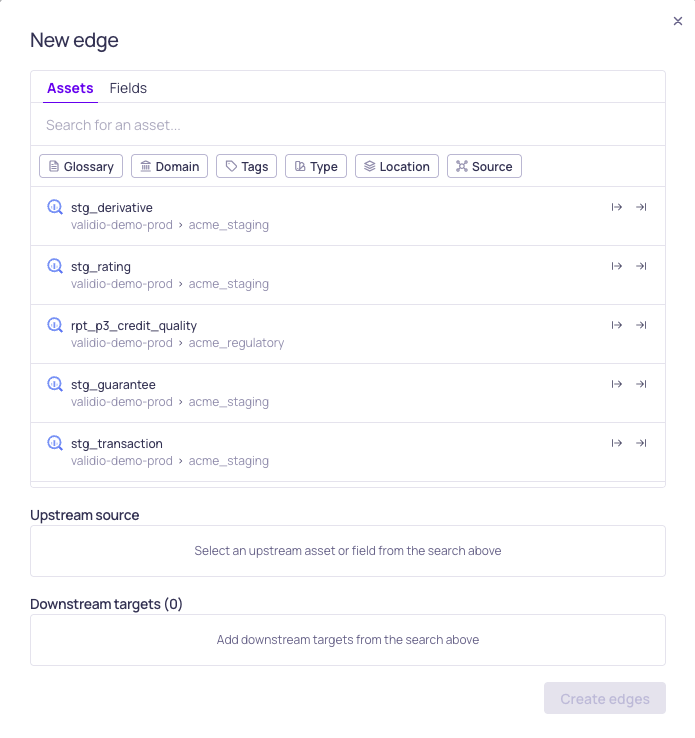
New edge (connections) configuration
Delete Connections
To delete a manually created connection:
- Click an edge in the graph to select it.
- Click Delete edge in the status bar.
- Confirm the deletion.
Access Lineage from Other Pages
You can navigate to the lineage page with a specific asset pre-set as anchor from:
- The Catalog Assets list -- Click View lineage in the asset sidebar.
- The Asset details page -- Open the i (information) sidebar, and click View lineage.
- The Source details page -- Open the i (information) sidebar, and click View lineage.
- A glossary term details page or sidebar -- Click View in lineage to open the graph anchored on the term's assignments (assets and schema fields). See Glossary Term Assignments.
From glossary term pages, you can also open the Domains tab focused on a specific term — see Using Domain Lineage.
Related Resources
Updated 14 days ago