Debugging an Incident
Use the Debug feature in Validio to generate sample SQL and investigate the data causing quality incidents.
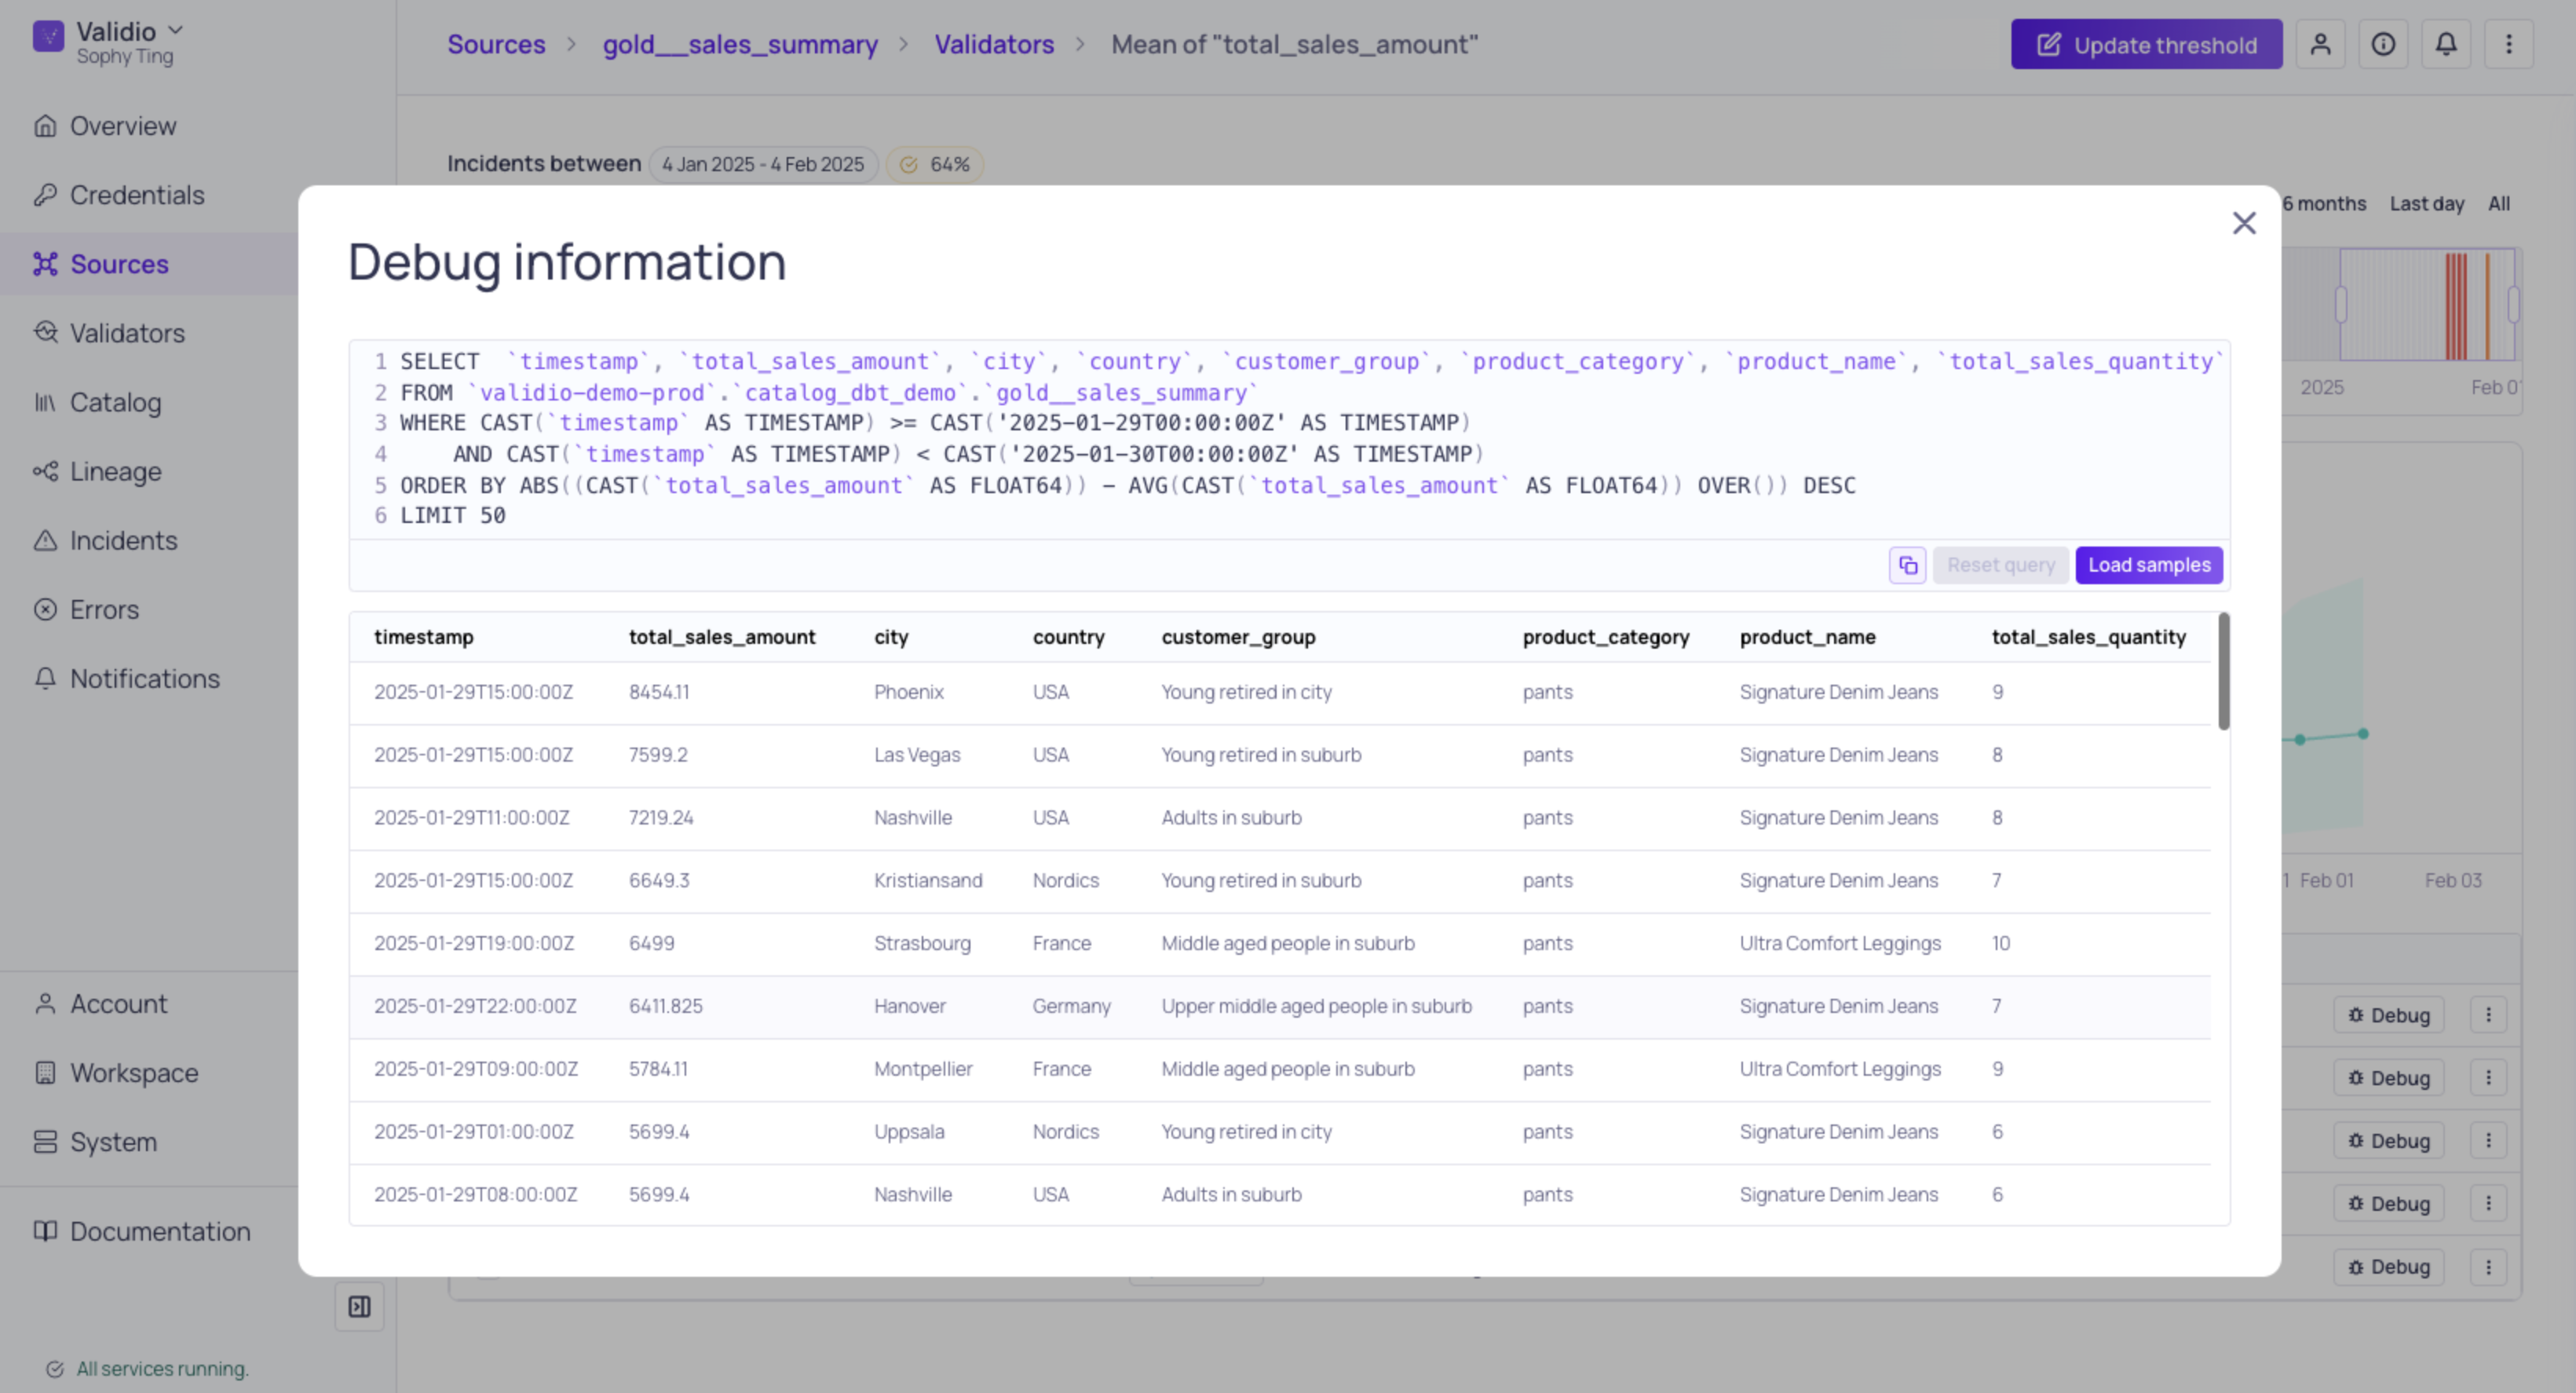
When investigating individual incident groups, the Debug feature generates sample SQL queries from captured incidents, allowing you to investigate the exact data causing quality issues directly in your database. For AI-assisted investigation, see Root Cause Analysis.
Debug Information for a Data Warehouse Source
Prerequisites for Debug
To use the Debug feature, ensure the following requirements are met:
- Source type: Debug is available for data warehouse and query engine sources where Validio uses SQL pushdown for validation.
- Permissions: Your role must have the following permissions in the namespace:
sqlExecution:WRITEandincidents:WRITE. See Managing Roles.
How Debug Works
The Debug feature is available where individual incidents are listed, such as in a details page for incident groups, and provides:
- Automatically generated SQL: Validio generates an executable SQL query that reproduces the data quality incidents. The query,
- Filters data down to the specific Window and Segment where the incident occurred.
- Orders records based on how far away they are from being allowed, returning the most prominent outliers at the top.
Troubleshooting Outliers
Although outliers are not the only cause of incidents, they are a good starting point for troubleshooting.
- Sample data generation: Use Load Samples for Validio to automatically generate sample rows from the detected incidents to help you troubleshoot.
- Query customization: Modify the generated queries to explore different aspects of the problem. If needed, Reset query to remove your edits and return to the original generated SQL.
- Copy support: Copy the query to run in your preferred database tools for deeper analysis.
Updated 3 months ago