About the Lineage Graph
Understand the Validio Lineage graph components, including nodes, layers, edges, and overlays.
The Lineage graph provides a visualization for the flow of data through your data stack. The graph is organized into layers (columns) from upstream (left) to downstream (right), with each layer representing a step in the data pipeline. The graph uses progressive loading to handle large lineages — only the nodes near your anchors are rendered initially, and additional connections load as you expand outward.
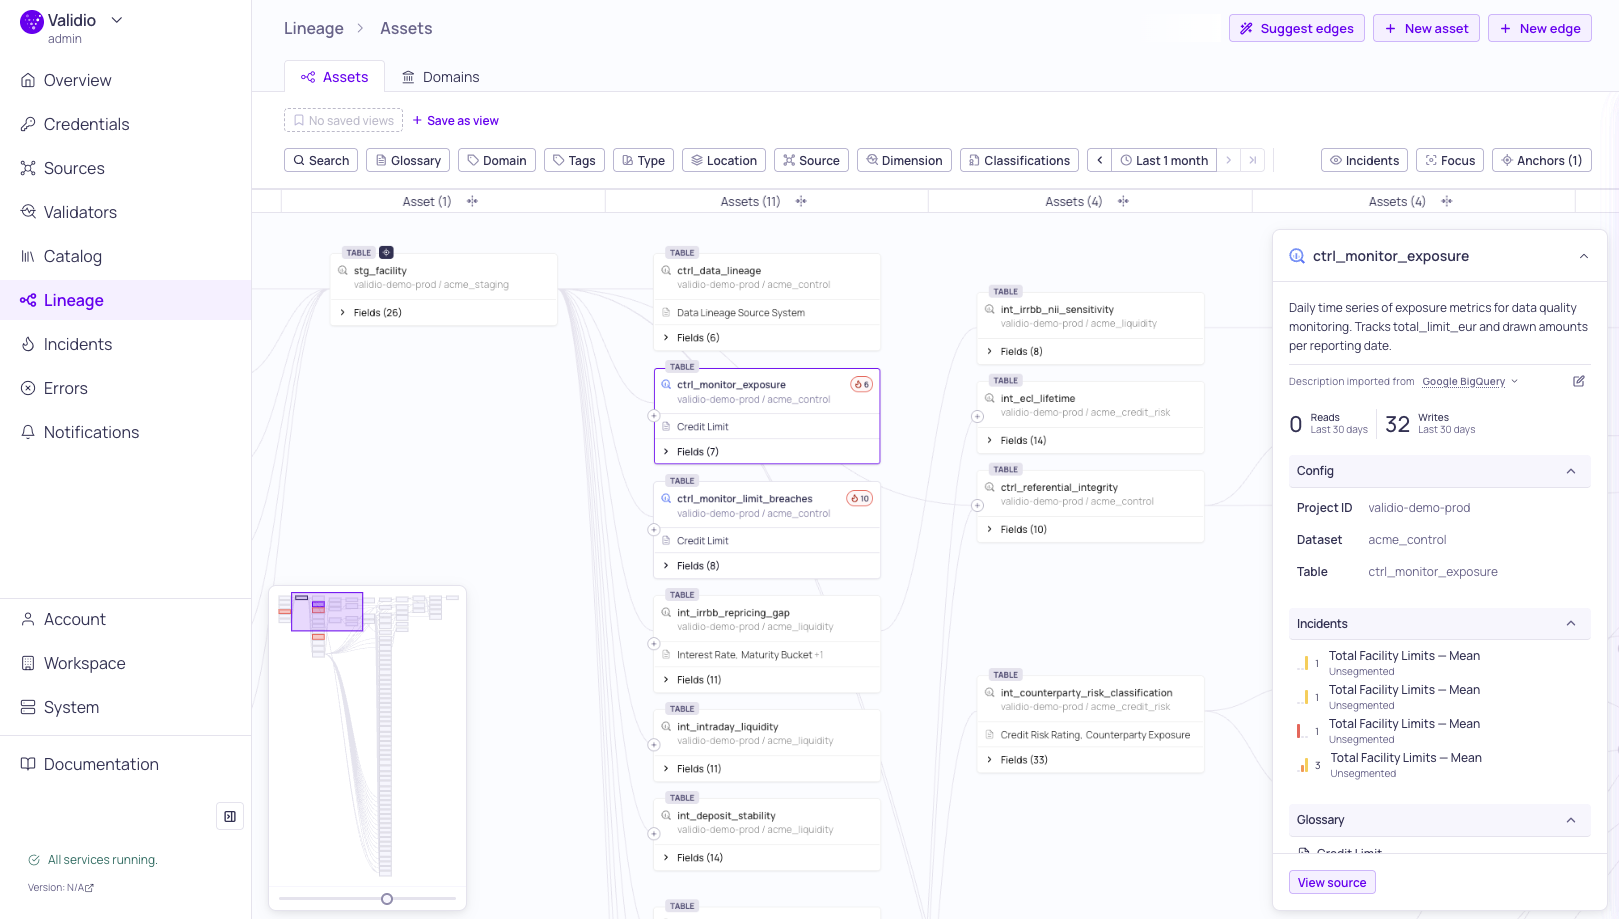
Lineage graph with Incidents overlay
Nodes
Each node in the lineage graph represents a catalog asset (dataset) such as a table, view, stream, or BI asset. Nodes display:
- Header -- The asset type (view, table, worksheet, and so on), asset name, source type icon, and field count. The node uses the asset's own name — for a Custom SQL source, this is the source name you gave it, so each node is individually identifiable.
- Fields -- Expand a node to see individual fields that have lineage relationships. Fields show their name and data type.
- Glossary terms -- Assigned glossary terms appear below the header as term chips. When more than two terms are assigned, overflow is shown as "+N" with a tooltip listing all terms.
- Source indicator -- Nodes that are configured as Validio monitored sources have a distinct border style.
Layers
The graph organizes nodes into layers based on their position in the data pipeline:
- Layer headers -- Each layer has a header at the top showing its position.
- Collapse and expand -- Click a layer header to collapse it into a compact dot node, reducing visual clutter. Edges route through collapsed layers. Use "Collapse all layers" or "Expand all layers" for bulk operations.
Collapsing intermediate layers is useful when you want to see the direct relationship between upstream sources and downstream consumers without the complexity of middle transformation steps.
Edges
Edges are the lines connecting nodes and fields. Validio supports both field-level and dataset-level lineage:
| Relationship Type | Description | Visual Style |
|---|---|---|
| Field to Field | A field impacts the data in another field (e.g., a SELECT clause). | Solid edge |
| Dataset to Dataset | A dataset impacts another dataset. | Dashed edge |
| Field to Dataset | A field impacts an entire dataset (e.g., a WHERE clause). | Dashed edge |
| Dataset to Field | A dataset impacts a field. Can only be created manually. | Dashed edge |
Edges can have descriptions that document the relationship between the connected assets. Click an edge to open the sidebar and view or edit its description. For more information, see Using Lineage.
Overlays
The lineage graph supports overlays that add contextual information to nodes:
- Data quality overlay -- Shows the data quality score on nodes, helping you quickly identify quality issues in your pipelines.
- Incidents overlay -- Shows color-coded indicators on nodes based on incident severity (high, medium, low) with a count of the incidents.
Overlay data reflects the time range selected in the page toolbar. Adjust the time range to view data quality or incidents over a specific period, such as the last week or month.
Minimap
A minimap in the bottom-left corner provides a bird's-eye view of the entire graph. The minimap includes:
- An interactive viewport rectangle that you can drag to navigate.
- A zoom slider for adjusting the zoom level.
Related Resources
Updated 15 days ago