About the Overview Page
The Overview page displays a summary of your Validio system setup, status, and recent activities.
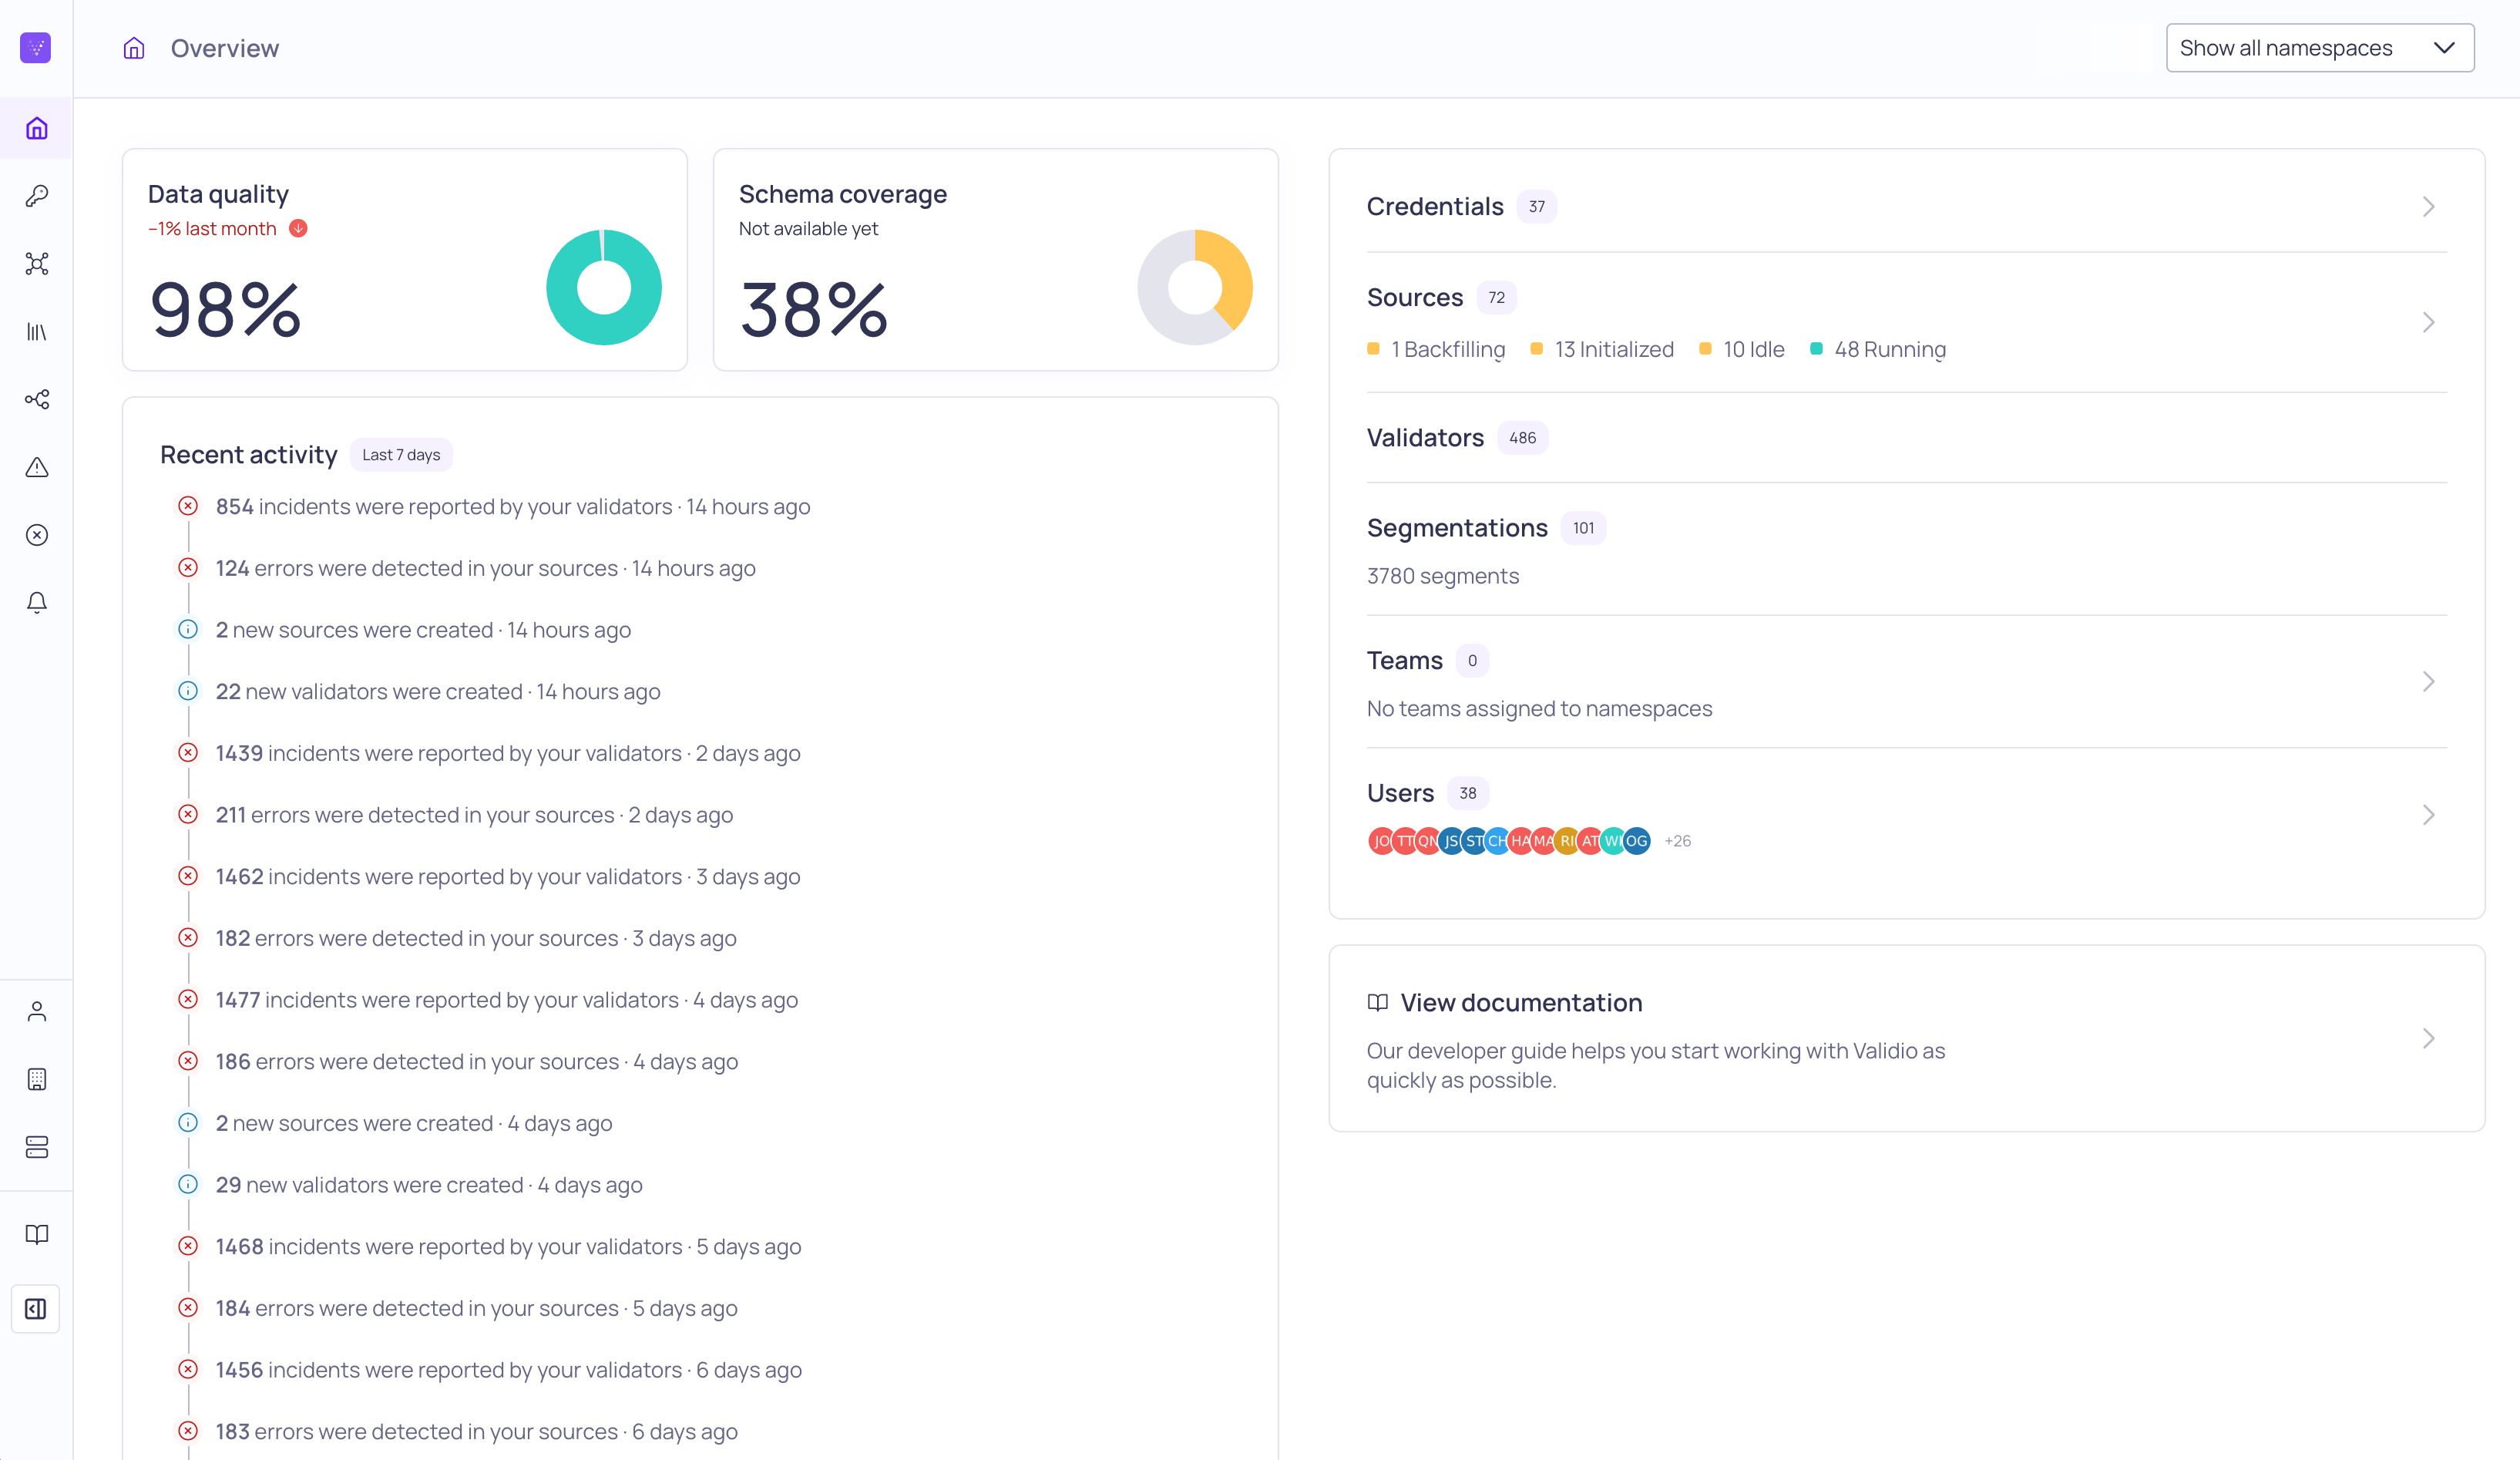
The Overview page in Validio
Data Quality Score
The Data Quality score is a measure of the data quality and will be calculated for each Segment, Validator, and Source. On the Overview page, the quality score is presented as a percentage that shows the overall data quality across all of your Sources, taking the average over a period of one month back in time.
The quality score is calculated as the number of incidents weighted by their severity and divided by the number of windows:
quality = 100 * (1 - (highSeverityCount * 3 + mediumSeverityCount * 2 + lowSeverityCount) / (highSeverityCount * 3 + mediumSeverityCount * 2 + lowSeverityCount + nonAnomaliesCount))
A quality score of 100% represents the case where no incidents have occurred during the lookback period. A quality score of 0% represents the case when all monitored metrics are causing incidents with high severity. For intermediate cases, the quality score is calculated as a weighted average of the incident severities.
Because of the severity weighting, high-severity incidents will reduce the quality score more than low-severity ones. Also, the score is normalized by the number of windows, so you will see the score change as you change the timeframe of the incidents graph.
Validio assigns the following color scheme when the data quality is displayed in graphs and tables:
- Score equal or above 90% → Green
- Score between 60% and 90% → Yellow
- Score below 60% → Red
Coverage Score
The Coverage score is a measure of how well you are monitoring your critical fields with validators. Having both Freshness and Row Count validators (either unsegmented or segmented) is recommended by Validio to check for data uptime and therefore account for 50% of the score. The remaining 50% is calculated from the proportion of fields that have a validator:
coverage = (has_freshness + has_row_count) * 0.25 + (number fields with validator / total fields in schema) * 0.5
Validio assigns the following color scheme to represent the coverage score:
- Score equal or above 50% → Green
- Score between 30% and 50% → Yellow
- Score below 30% → Red
The following table illustrates examples of coverage score calculation and color assignment.
| Scenario | Score | Color |
|---|---|---|
| Freshness and Row Count validators | 50% (25% each) | Green |
| Just Freshness (or just Row Count) validator | 25% | Red |
| Freshness, Row Count, and 5 of 16 different fields of the schema have a validator | 66% | Green |
| 3 Numeric validators out of 11 fields | 14% | Red |
Installation in Numbers
Shows a summary of your system installation:
- Credentials--The number of configured credentials.
- Sources--The number of configured Sources and their statuses.
- Validators--The number of configured Validators.
- Segments--The number of fields with Segmentation applied and the number of segments.
- Teams--The number of teams assigned to Namespaces.
- Users--The number of users.
Recent Activity
Shows a list of activities that occurred in your Validio system in the past 7 days.
Onboarding Cards
Depending on the state of your installation, Validio suggests options for configuring components or adding new users in your system.
Updated 4 months ago