Viewing Incident Details
The incident details view gives comprehensive information for analyzing and triaging an incident.
How to find the Incident details page?
You can navigate to this page by clicking on a specific Incident on the Incidents page,

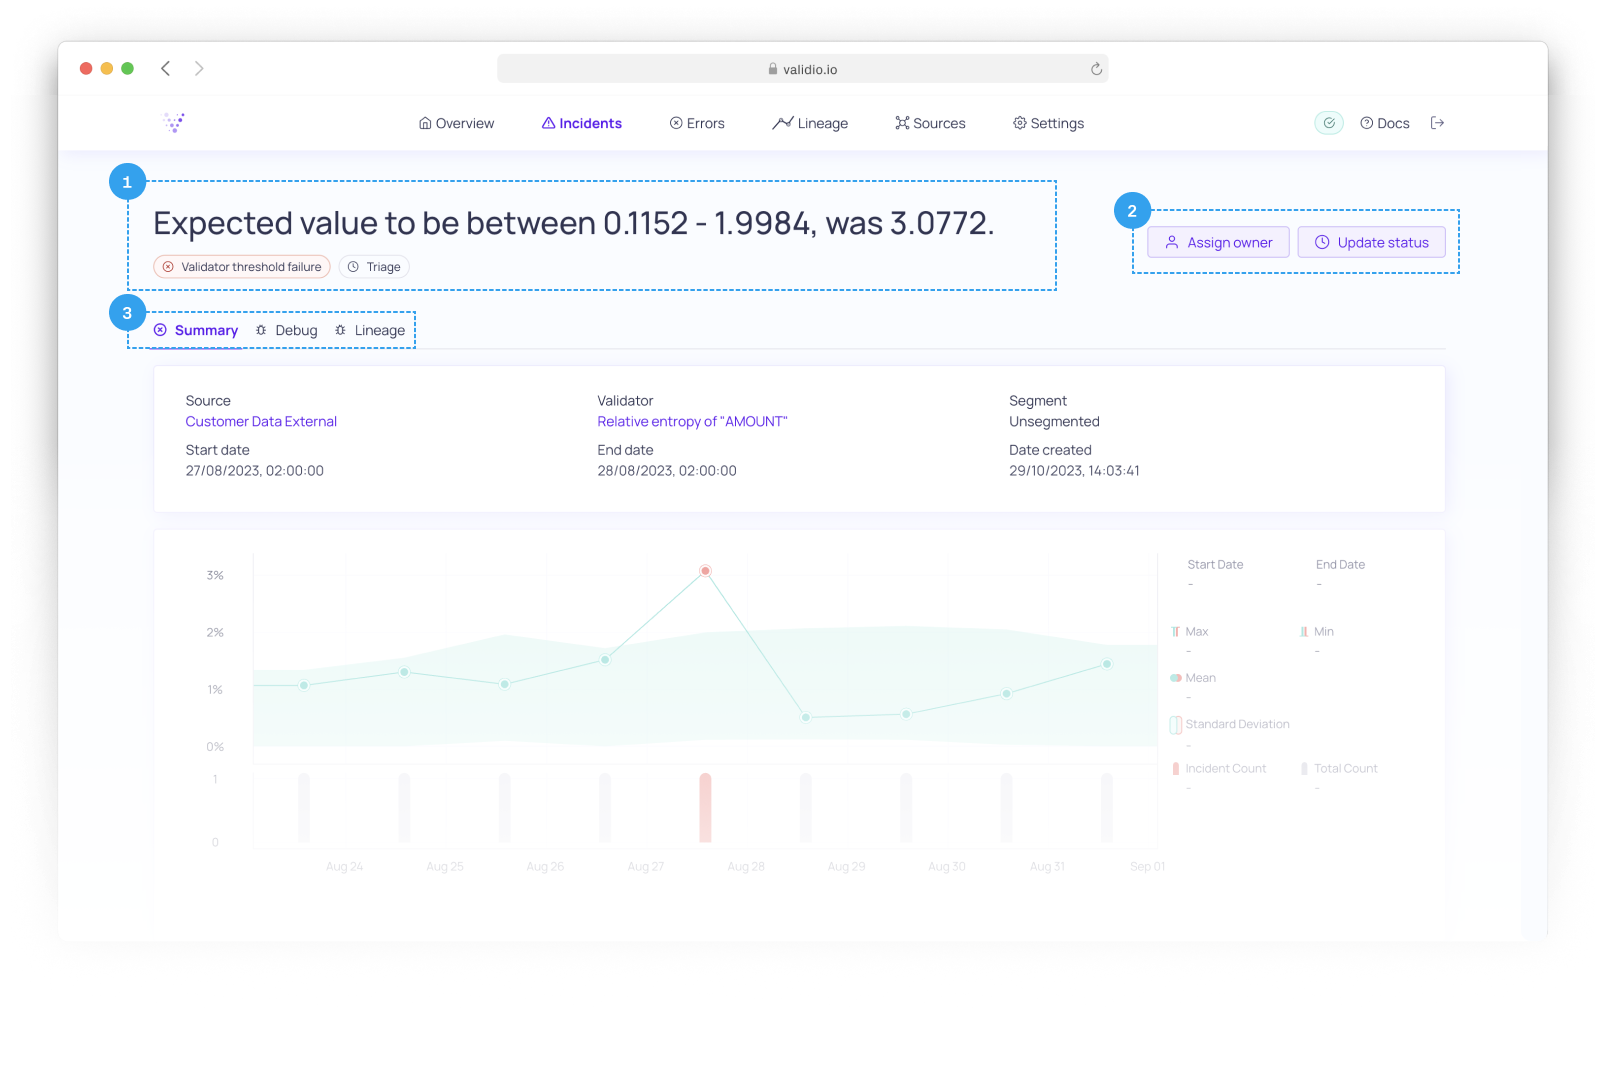
Incident details
1. Incident summary
- Description - A text describing the incident.
- Type - For example
Validator threshold failure. - Owner - Username of any owner assigned to the incident.
- Status - For example
Investigating.
2. Triage the Incident
- Click on Assign owner to assign, change, or remove the owner of the incident.
- Click on Update status to change the status of the incident.
- Click on
⋮menu to:
3. Incident tabs
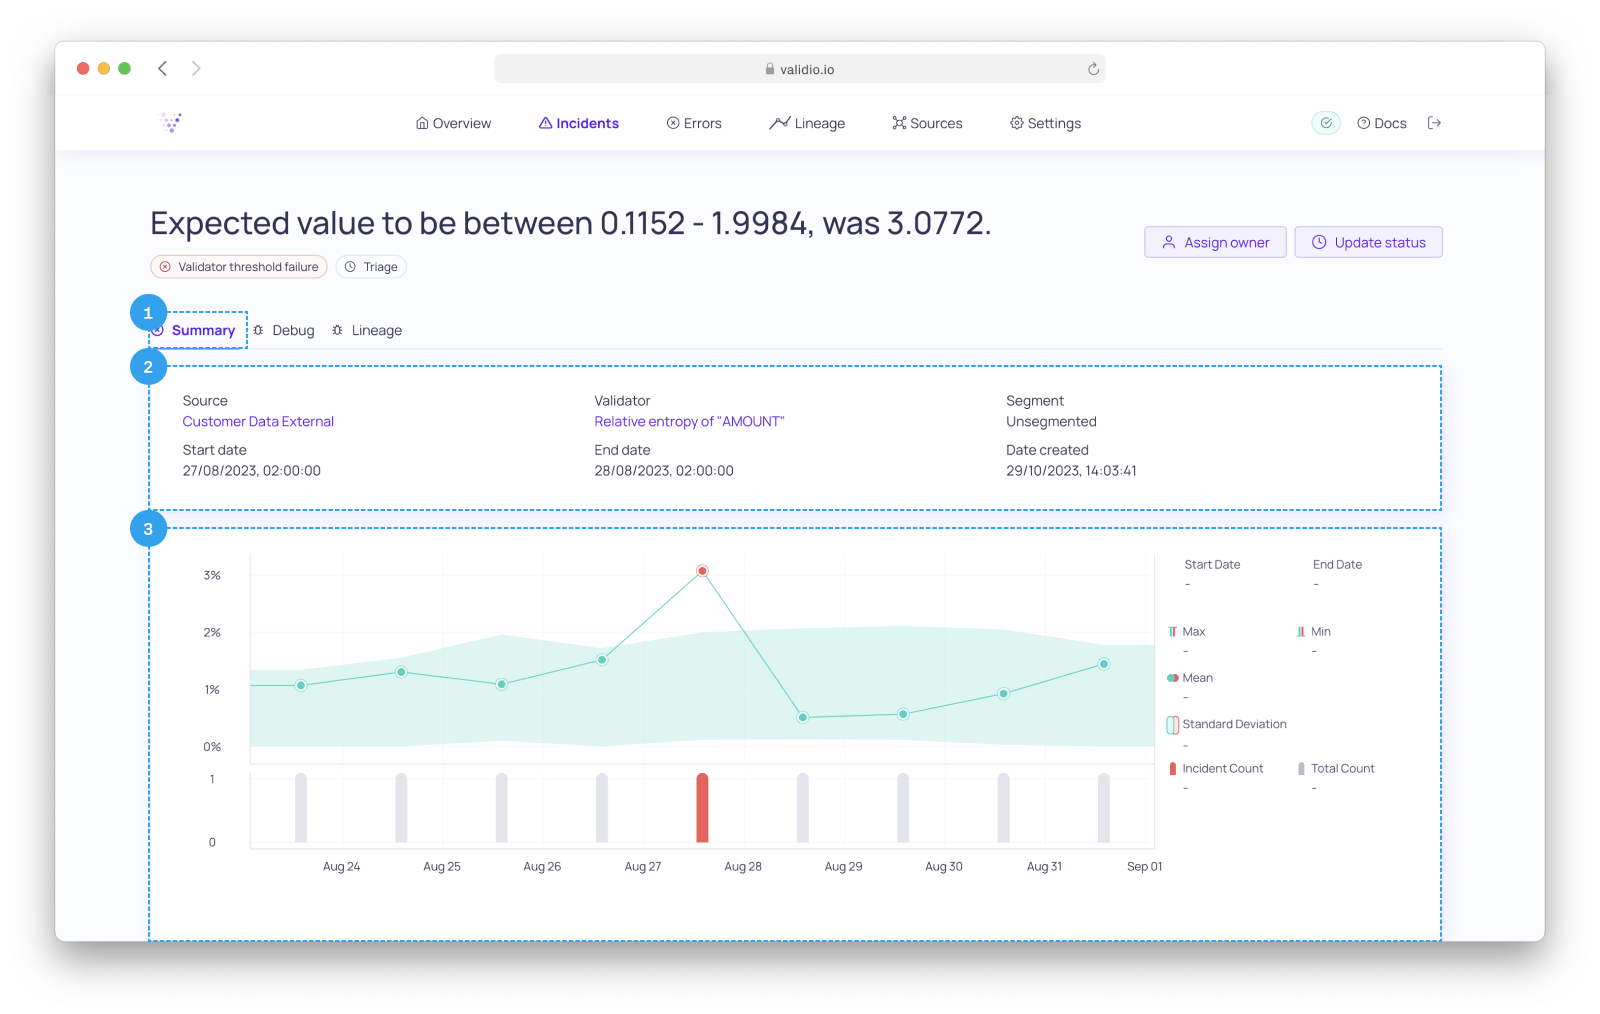
Summary
- Click on the Summary tab to find detailed information about the incident.

Summary tab with graph showing Incident details
- View summarized information about the incident.
- View a graph zoomed in on the incident.
Note that you can click on the
SourceorValidator, in the incident summary, to navigate to their respective pages.
Debug
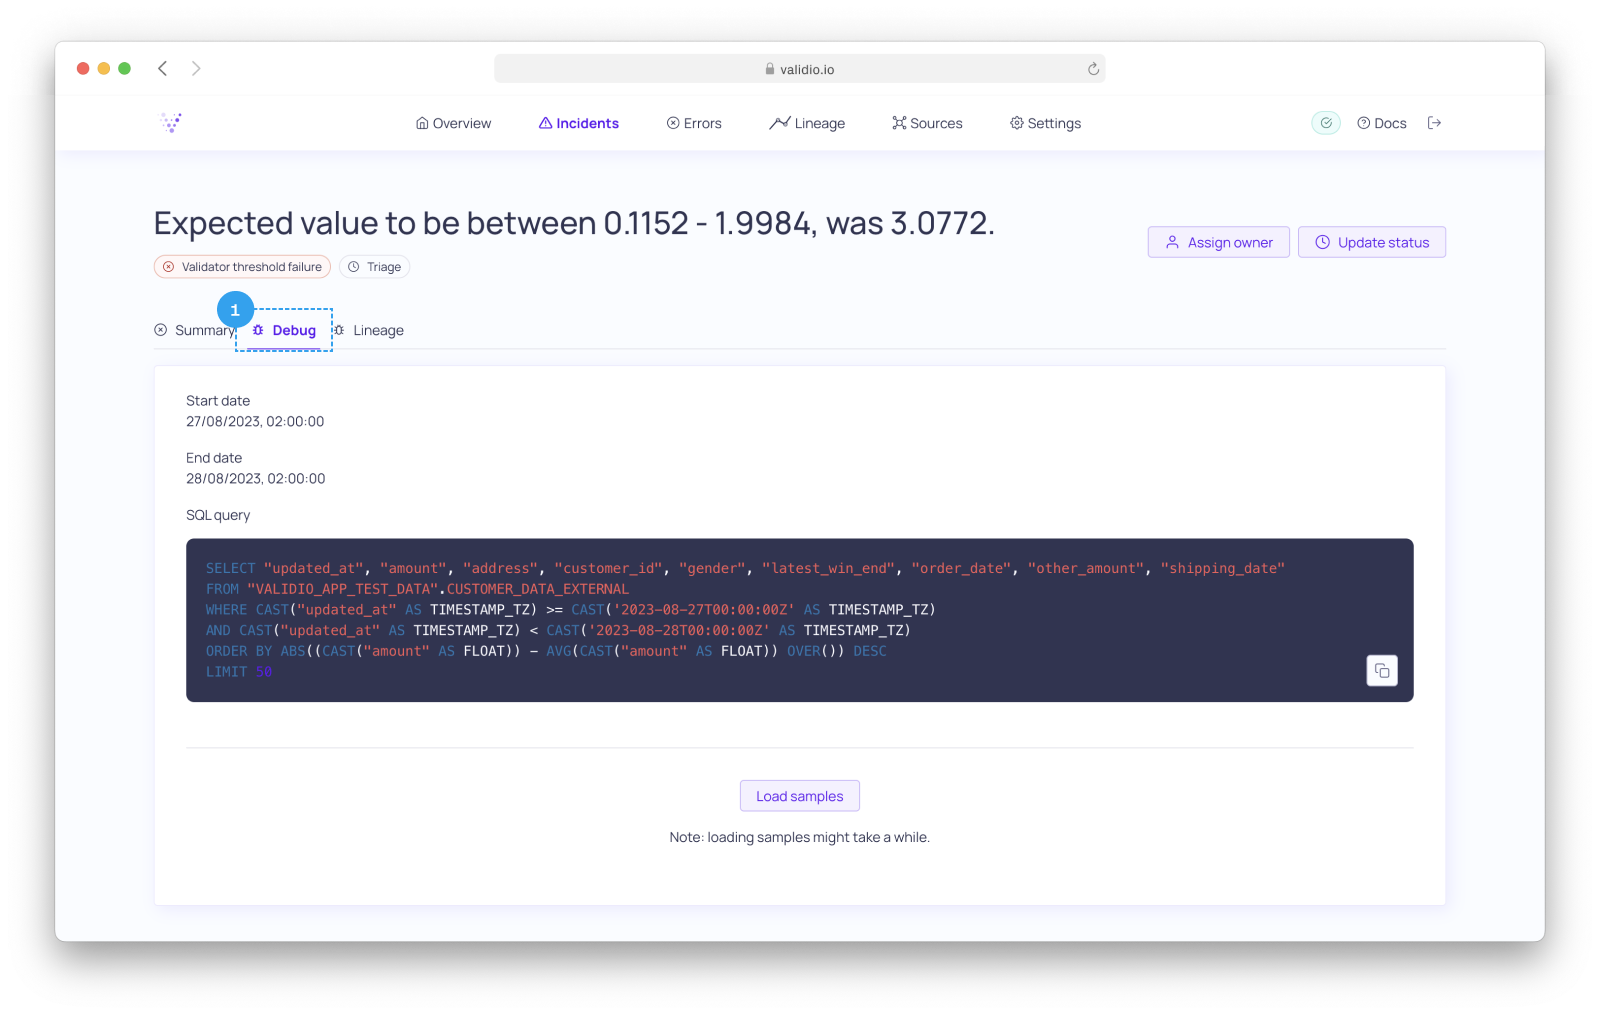
- Click on the Debug tab to find helpful information for debugging the incident.

Debug tab with SQL query
- Start date and End date - Timestamps for the Window in which the incident was captured.
- SQL query - For Data Warehouse and Query Engine sources, you will see the section SQL query. This section contains an auto-generated SQL query, designed for troubleshooting incidents.
- The query filters data down to the specific Window and Segment where the incident occurred.
- The query orders records based on the distance of their metric field from the mean, effectively returning the most prominent outliers at the top. It is important to note that outliers are not the only cause of incidents. However, analyzing outliers is usually a good starting point for troubleshooting.
- You can click on Load samples to immediately view the query result. Alternatively, you can copy the query text to your favorite IDE and modify it as needed.
Note that SQL query is only available for sources where Validio utilizes SQL pushdown for validation, which is common for Data Warehouses and Query Engines.
- Bucket - For Object Storage sources, you will see the section Bucket. This section contains information about the bucket and file(s) holding the data where the incident was found. From here you can navigate to, download, or copy the link to, the file(s).
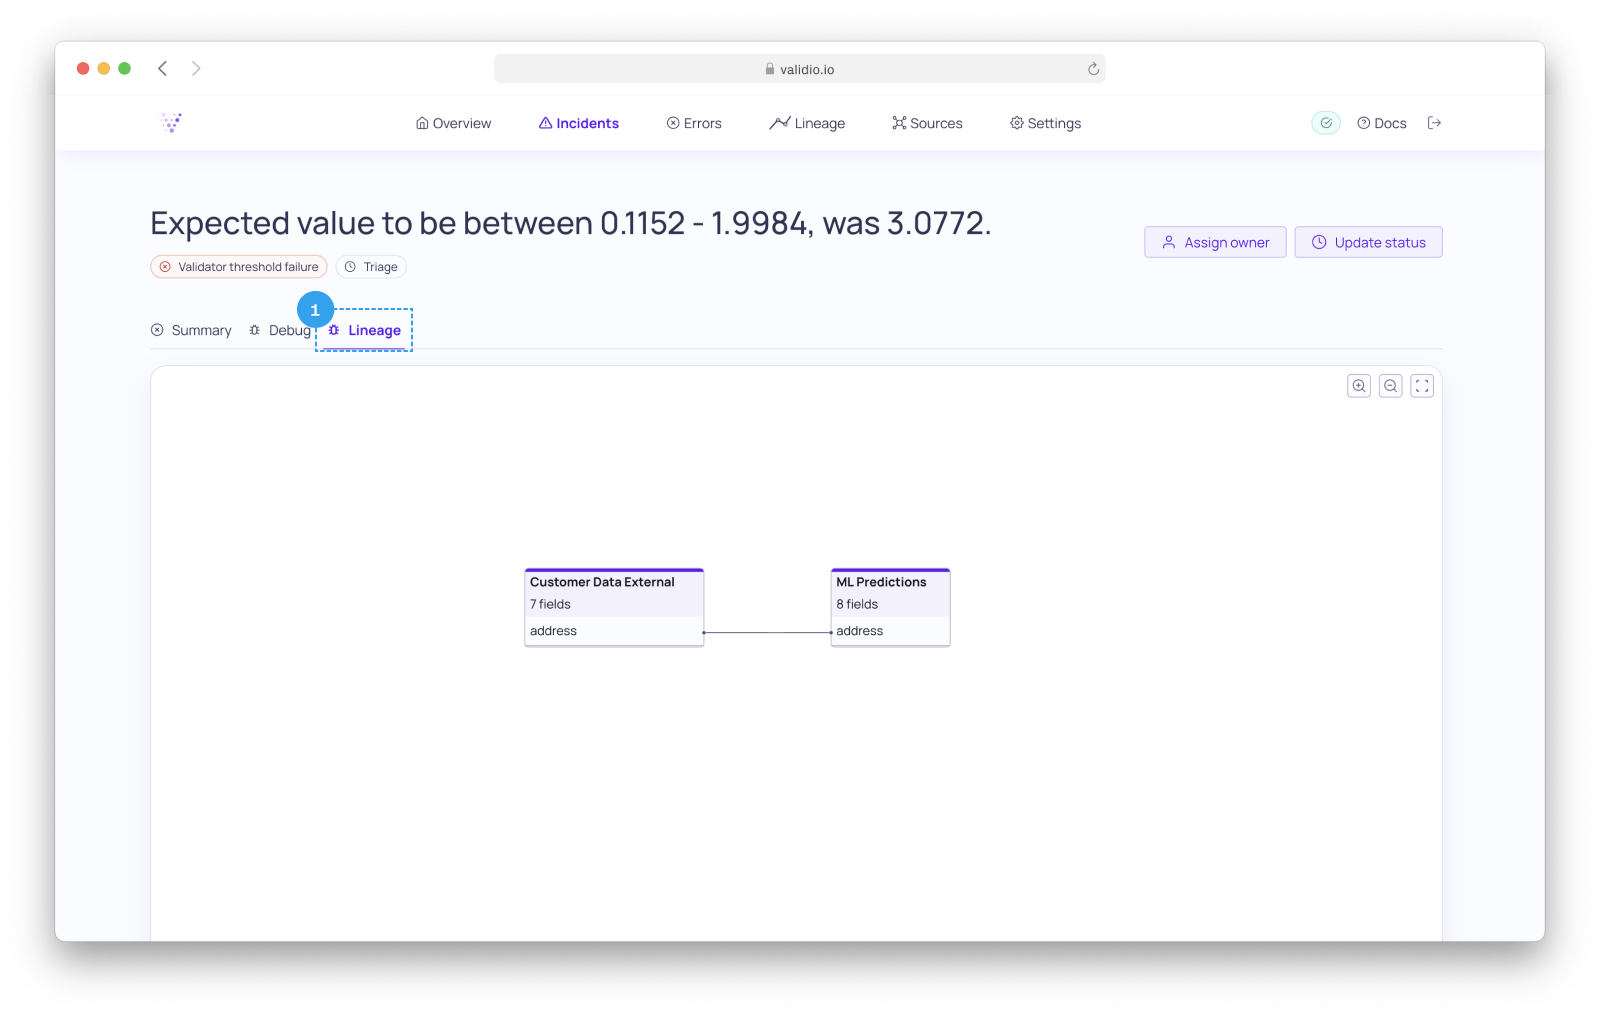
Lineage
- Click on the Lineage tab to see a Lineage graph isolating the asset related to the Incident, as well as downstream assets.

Updated 10 months ago
