Configuring Dynamic Thresholds
Dynamic Thresholds use a combination of smart algorithms to automatically detect anomalies in your data. The threshold model infers trends, seasonality, and peaks, and also adapts to shifts in your data. It learns from historical data and is trained on new data, continuously improving as more data is read.
When applied to a backfilled source, the dynamic thresholds can quickly detect upcoming anomalies without any training period. This means you get incidents and insight immediately, even if you lack the domain knowledge to create appropriate thresholds. You can also provide input to improve the anomaly detection algorithm. For more information, see Model Retraining.
Dynamic thresholds will continuously track and automatically update when it detects shifts in seasonality and trends. You can use dynamic thresholds to monitor sources where you expect changes in your data over time. For more information, see Seasonality Detection.
Dynamic thresholds include functionality to estimate the support of the metric and automatically adjust the lower decision bound accordingly. For more information, see Metric Support.
Dynamic Threshold Parameters
The following table lists the parameters for configuring a dynamic threshold. All validator types will have the same configuration options.
Parameter name | Parameter value | Validator Type |
|---|---|---|
Decision Bounds | Upper and Lower | All |
(Preset) Sensitivity | (Wide) 1.2 | All |
Adaption Rate | Fast | All |
Decision Bounds
The decision bounds type on the dynamic threshold specifies whether the boundaries for anomaly detection are double or single-sided:
- Upper and lower–Detects both upper and lower anomalies.
- Upper–Treats only upward deviations as anomalies. For example, this is the default for freshness validators. You do not want to be alerted about too fresh data but rather when your data is late.
- Lower–Treats only downward deviations as anomalies.
Sensitivity
Sensitivity defines the accepted range of values for the dynamic threshold.
- Higher sensitivity (lower threshold)–Means that the accepted range of values is more narrow, and the model will identify more data quality incidents or anomalies, leading to more alerts. Higher sensitivity is best suited for your most important tables.
- Lower sensitivity (higher threshold)–Implies a wider range of accepted values, resulting in fewer incidents and alerts. Lower sensitivity is ideal for less important tables that have historically produced noisy incidents.
Setting the right sensitivity is often an iterative process to find a balance between false positives and alert fatigue versus false negatives and missing real errors. The typical starting sensitivity value for testing is between 2 and 3. The default sensitivity in Validio is 2.0.
The following table maps the numeric value of Validio sensitivity presets to standard deviations:
| Sensitivity Preset Options | Validio Sensitivity Values | Standard Deviations |
|---|---|---|
| Narrow | 3.2 | 2.5 |
| Default | 2.0 | 4 |
| Wide | 1.2 | 5.5 |
Adaption Rate
You can configure how quickly the dynamic threshold adapts to changes in your data. This is controlled by the adaption rate parameter, which offers two settings:
- Fast–The dynamic threshold model responds rapidly to shifts in your data's behavior. This means that if a new trend or pattern emerges, the bounds within which data is considered "normal" will adjust quickly. This is useful if you have that your data patterns change often.
- Slow–The dynamic threshold model to adjust its bounds more gradually. The model will still adapt to changes, but it will do so over a longer period, giving more weight to historical data. This setting is ideal for more stable data and where the user may not want rapid changes of the bounds but still alert on large outliers.
Backfill after changing the adaption rateFor an existing validator, changing the adaption rate from
FasttoSlowand vice-versa without a backfill results in a discontinuity in dynamic threshold bounds on the first window after the change is applied. For a consistent behavior on historical data, we recommend that you either backfill the source after changing the adaption rate, or duplicate the validator and backfill the new one.
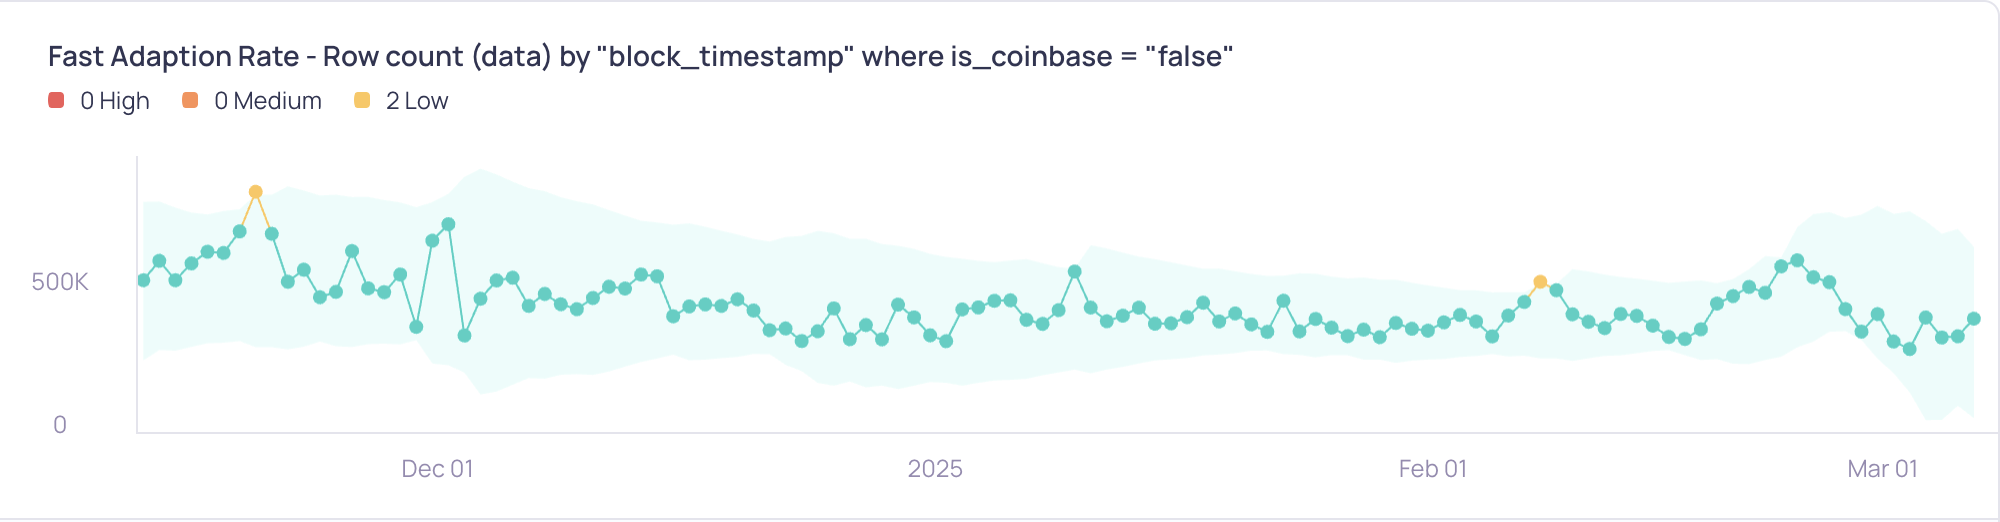
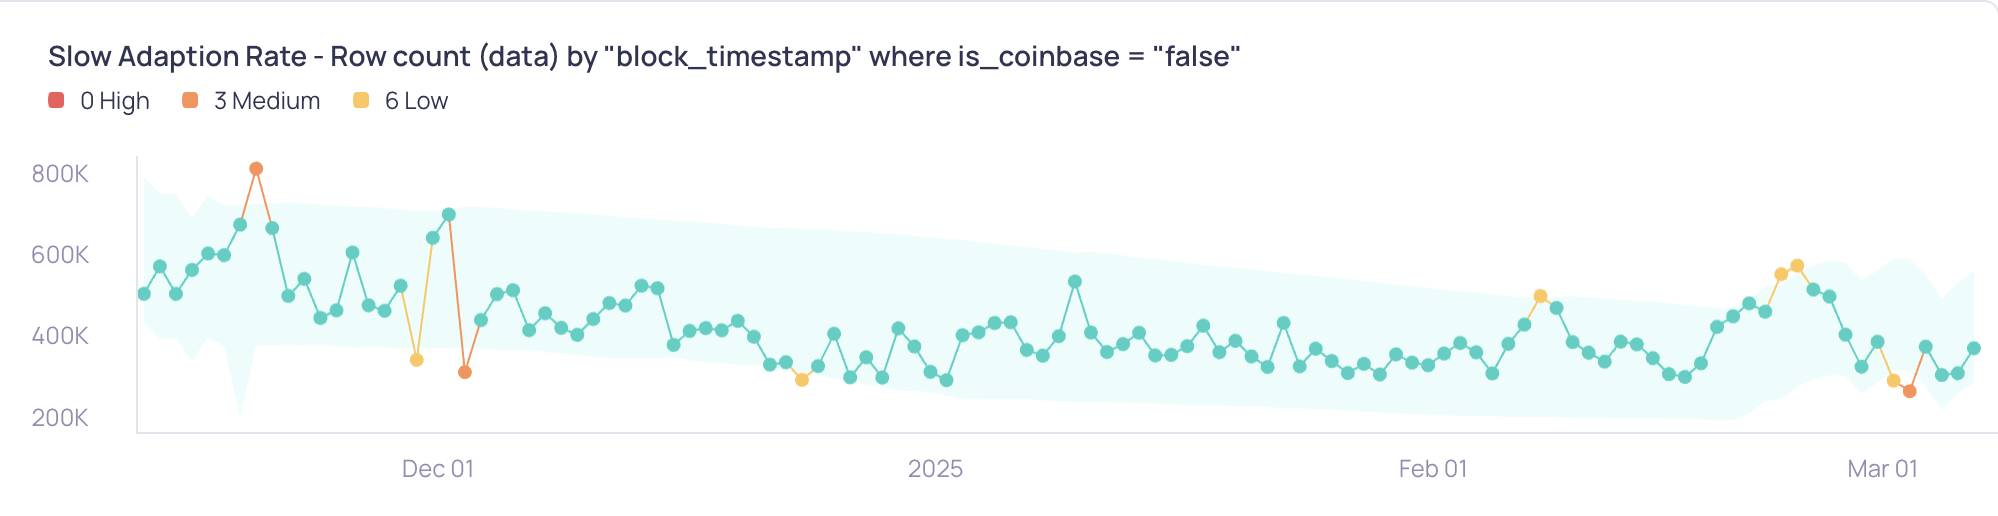
Adaption Rate Examples
The following example illustrates bounds of dynamic threshold with different adaption rates. Bounds for Fast widen and narrow more rapidly with changes in data, while the bounds for Slow are more persistent in following the downward trend and triggering alarms when the trend changes.
Use Cases and Recommendations
The choice between Fast and Slow adaption depends on the characteristics of your data and your monitoring goals.
| Use Case | Recommended Setting | Explanation |
|---|---|---|
| Volatile Metrics: Metrics that frequently experience significant, genuine shifts (such as stock prices and social media trends). | Fast | You want the threshold to quickly adapt to new trends and avoid prolonged periods of false positives. The bounds "catch up" and react quickly to recent variations in data. |
| Stable Metrics with Occasional Spikes: Metrics that are generally stable but may have short-term, anomalous spikes (such as conversion rates and error rates). | Slow | You want to minimize the impact of temporary deviations. Slow adaption rate makes Dynamic Threshold less sensitive to small variations in data (noise), while still catching large spikes and deviations. |
| Metrics with Changing Trends: Metrics that exhibit slow, consistent changes over time (such as user growth and monthly sales). | Slow | The Slow setting puts more weight on historical data which makes the bounds more persistent in following a trend. This is useful to alert on changes in trends and slow moving metrics. |
| New Data Sources: When monitoring a new data source with an unknown pattern. | Fast | For new data where you want to avoid too many incidents initially. The Fast adaptation rate allows the bounds to react and adjust quickly, making alerts less frequent. |
Default adaption behaviorThe
Fastsetting represents the previous default behavior of Validio's dynamic thresholds. If you have existing validators using dynamic thresholds and do not explicitly set the adaption rate, they will continue to behave as before (with Fast adaption) until you manually change the adaption rate.
Model Retraining
You can help improve the anomaly detection on dynamic thresholds by giving feedback on detected incidents. To give feedback, you need to change the triage state of the incident to “False Positive”, which means the incident is not an anomaly. This feedback is used to retrain the threshold model to become more precise.
For example, when you resolve an incident (that was detected at any point in the past) to False Positive, the threshold model is less likely to wrongly detect future data points as incidents if they appear in a similar context and have a similar value. Retraining the model in this way can help minimize alert fatigue and the amount of falsely detected anomalies.
For example, as shown in the figure for the "TOTAL_SALES_AMOUNT" Validator, three data points exceeded the dynamic threshold, resulting in "High" severity alerts. By marking these incidents as “False Positive,” the model will learn from these cases, adjusting the bounds so that values in a similar context and magnitude are less likely to be flagged in future detections.
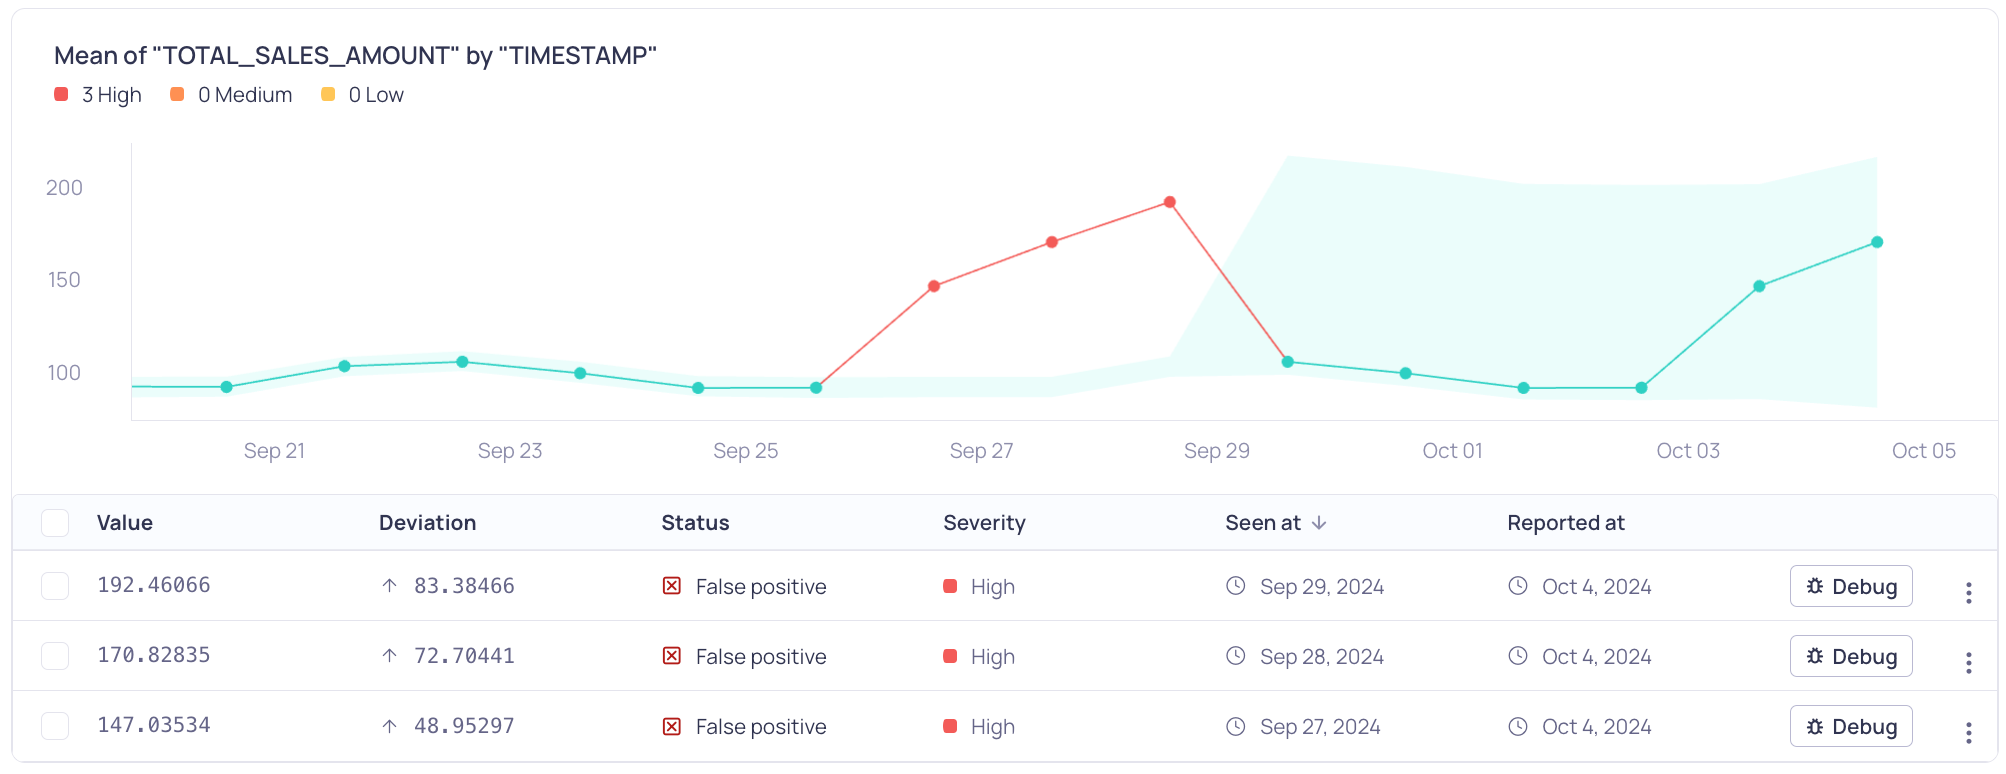
Mean of TOTAL_SALES_AMOUNT by TIMESTAMP
Each "False Positive" feedback recalibrates threshold bounds based on the current data, reducing sensitivity for similar patterns. However, major shifts in data may need further feedback.
Clearing retrained eventsYou cannot undo the feedback to the threshold model after setting an incident status to False Positive. However, you can clear retrained events if you delete and recreate a validator or reset the source. For more information, see Managing Incidents.
Changes appear progressive as more feedback is provided, making the threshold less sensitive to repeated false positives.
Seasonality Detection
Dynamic thresholds can automatically adapt to seasonality patterns that appear in your data which is related to the calendar. You do not have to enable or configure this feature. When there is enough evidence in your data to support the pattern detection, the dynamic threshold will adapt and not trigger an incident if it is caused by the seasonality.
- Calendric Seasonality–Seasonal patterns can appear in your data due to the calendar. Calendric seasonality can relate to business processes and cycles where work may be planned and reviewed in regular cycles that may be weekly, bi-weekly, or monthly, and this behavior is reflected in your data. One example of calendric seasonality is recognizing that a Volume validator returns 0 on all days except the days when the pipeline runs and ingests data.
Metric Support
Dynamic thresholds include functionality to estimate the support of the metric by partitioning the sample space (where data can appear) into negative values, zeros, and positive values. Depending on the frequency of the support, the metric gets an estimated positive, non-negative, or unbounded support. The estimated support is not static--it can change over time.
Depending on the estimated support, the lower decision bound is adapted:
- If the estimated support is positive, values which are zero or negative are considered incidents.
- If the estimated support is non-negative, negative values are considered incidents.
Updated 5 months ago